Now that we’ve analyzed both the ![]() H-NMR and the
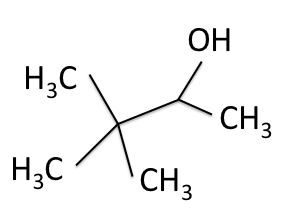
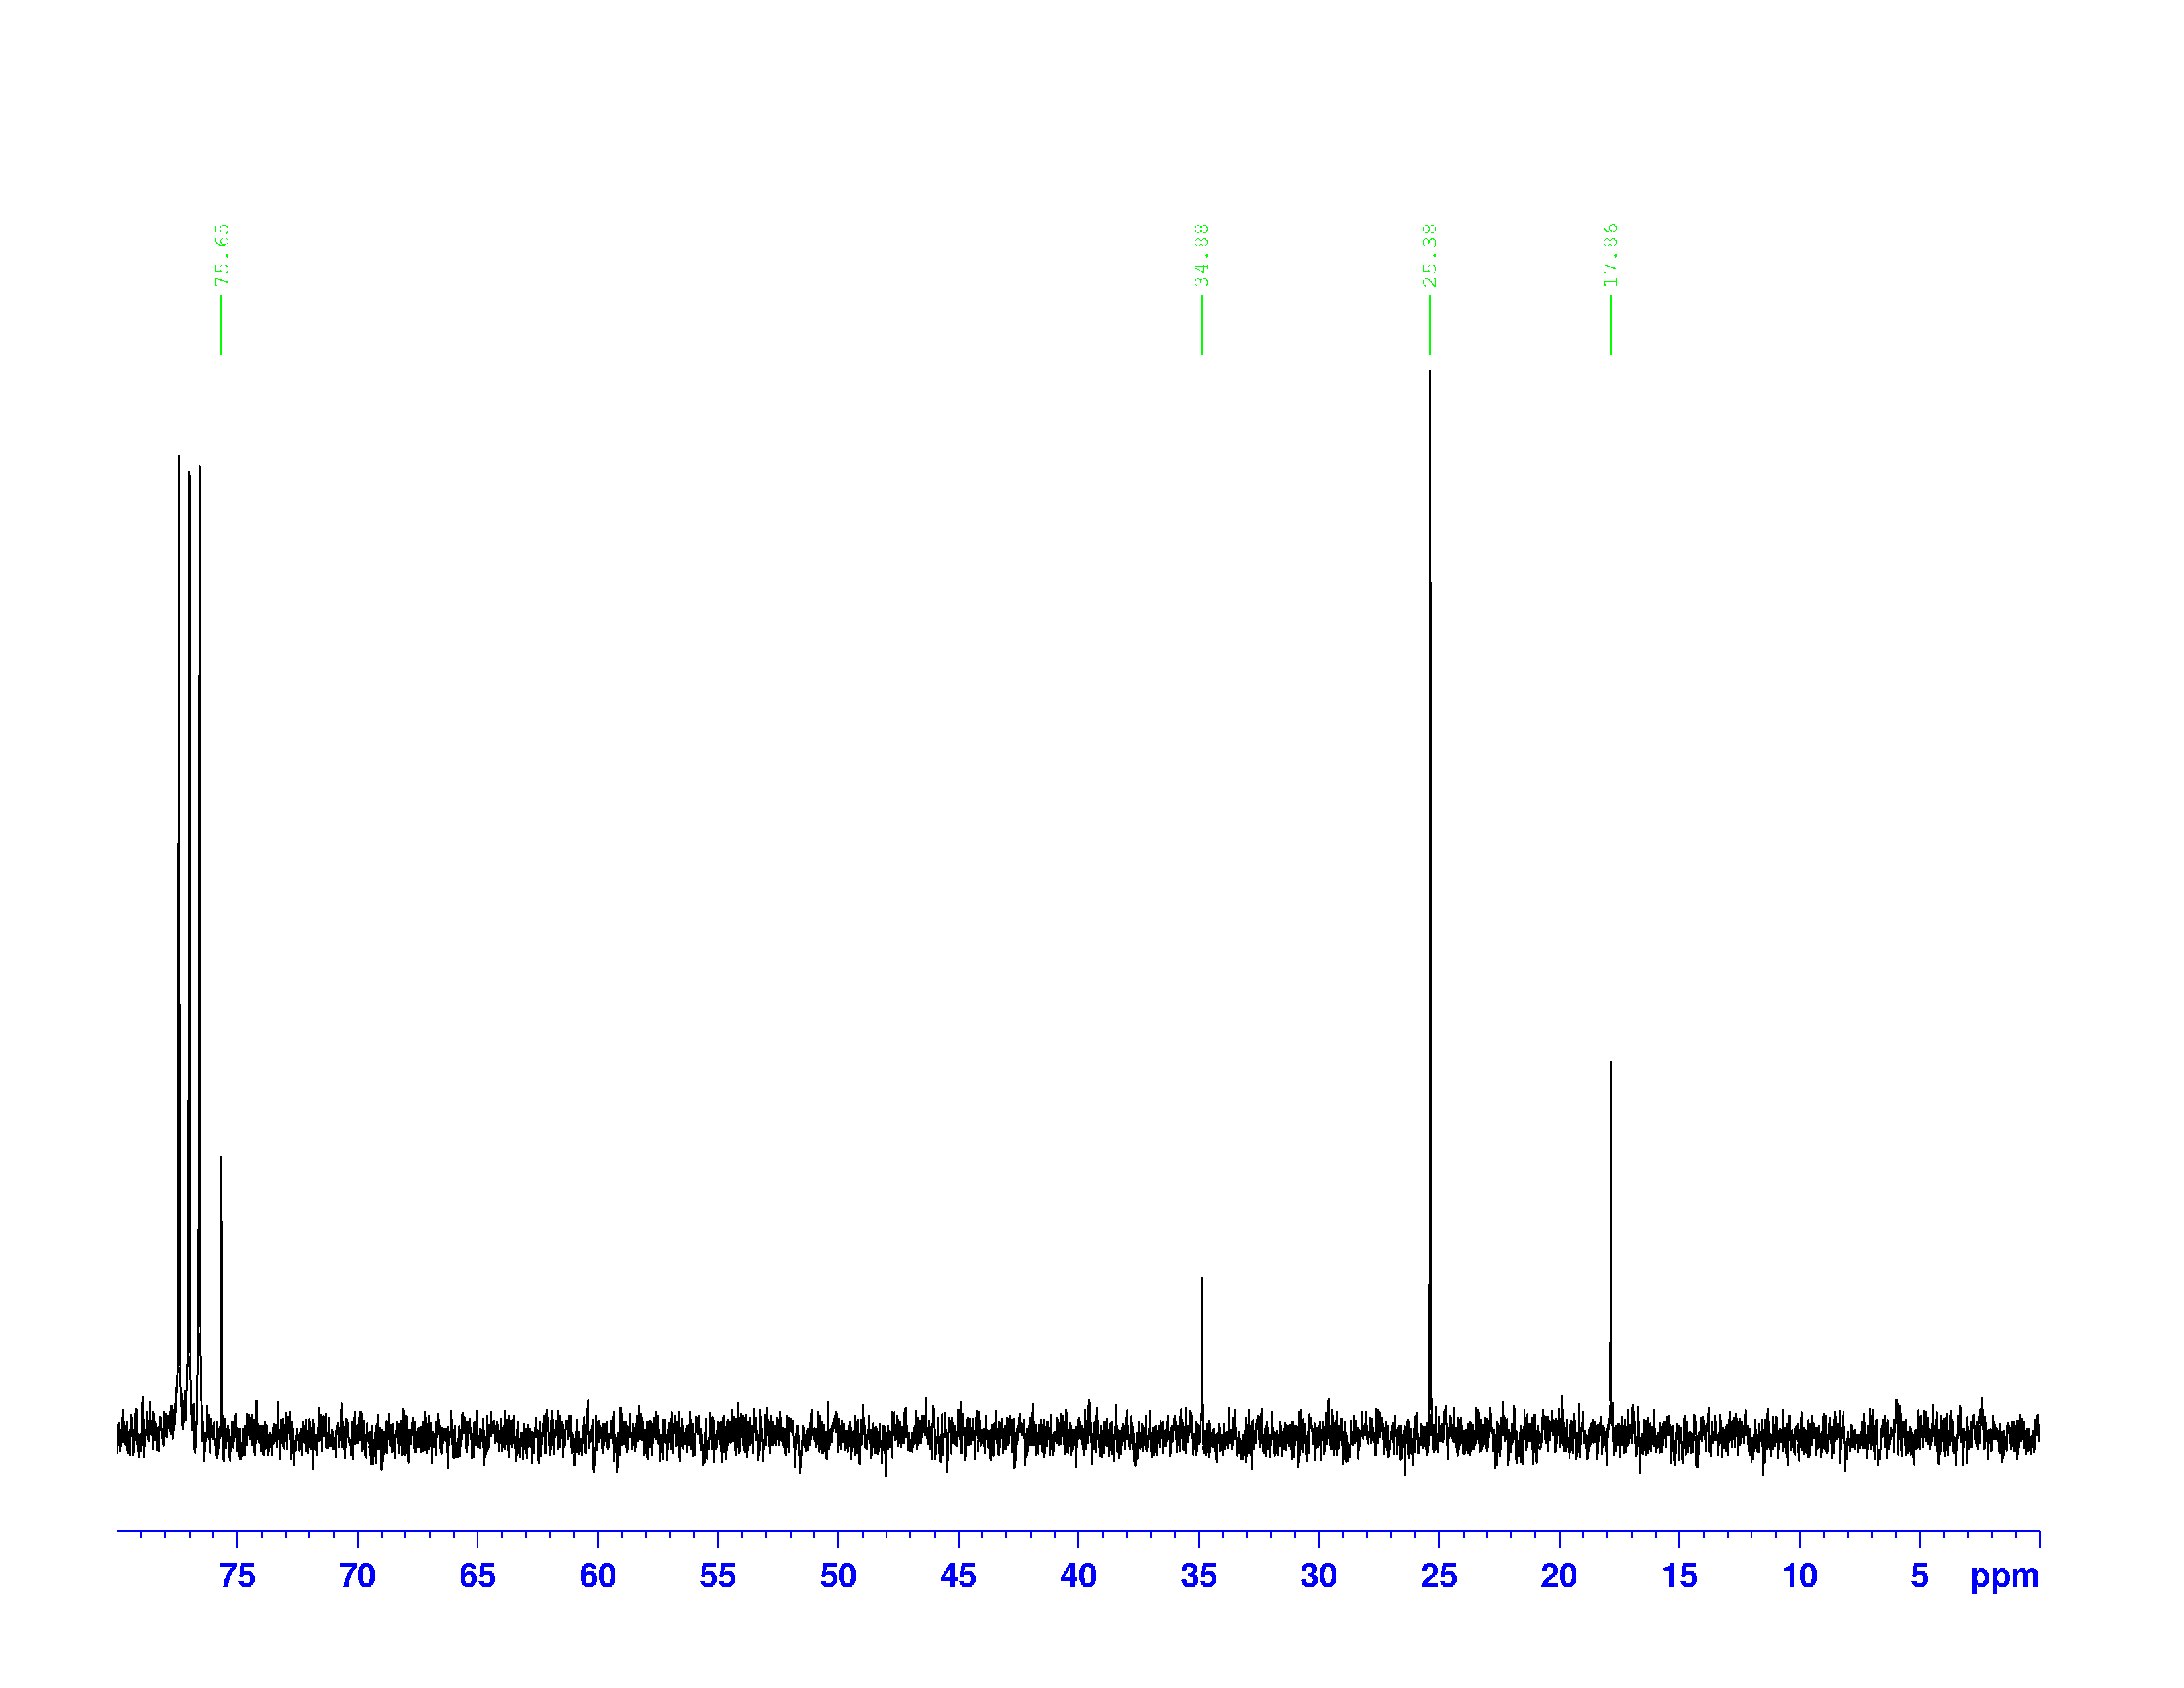
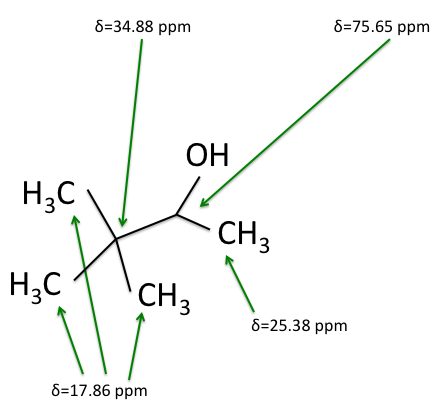
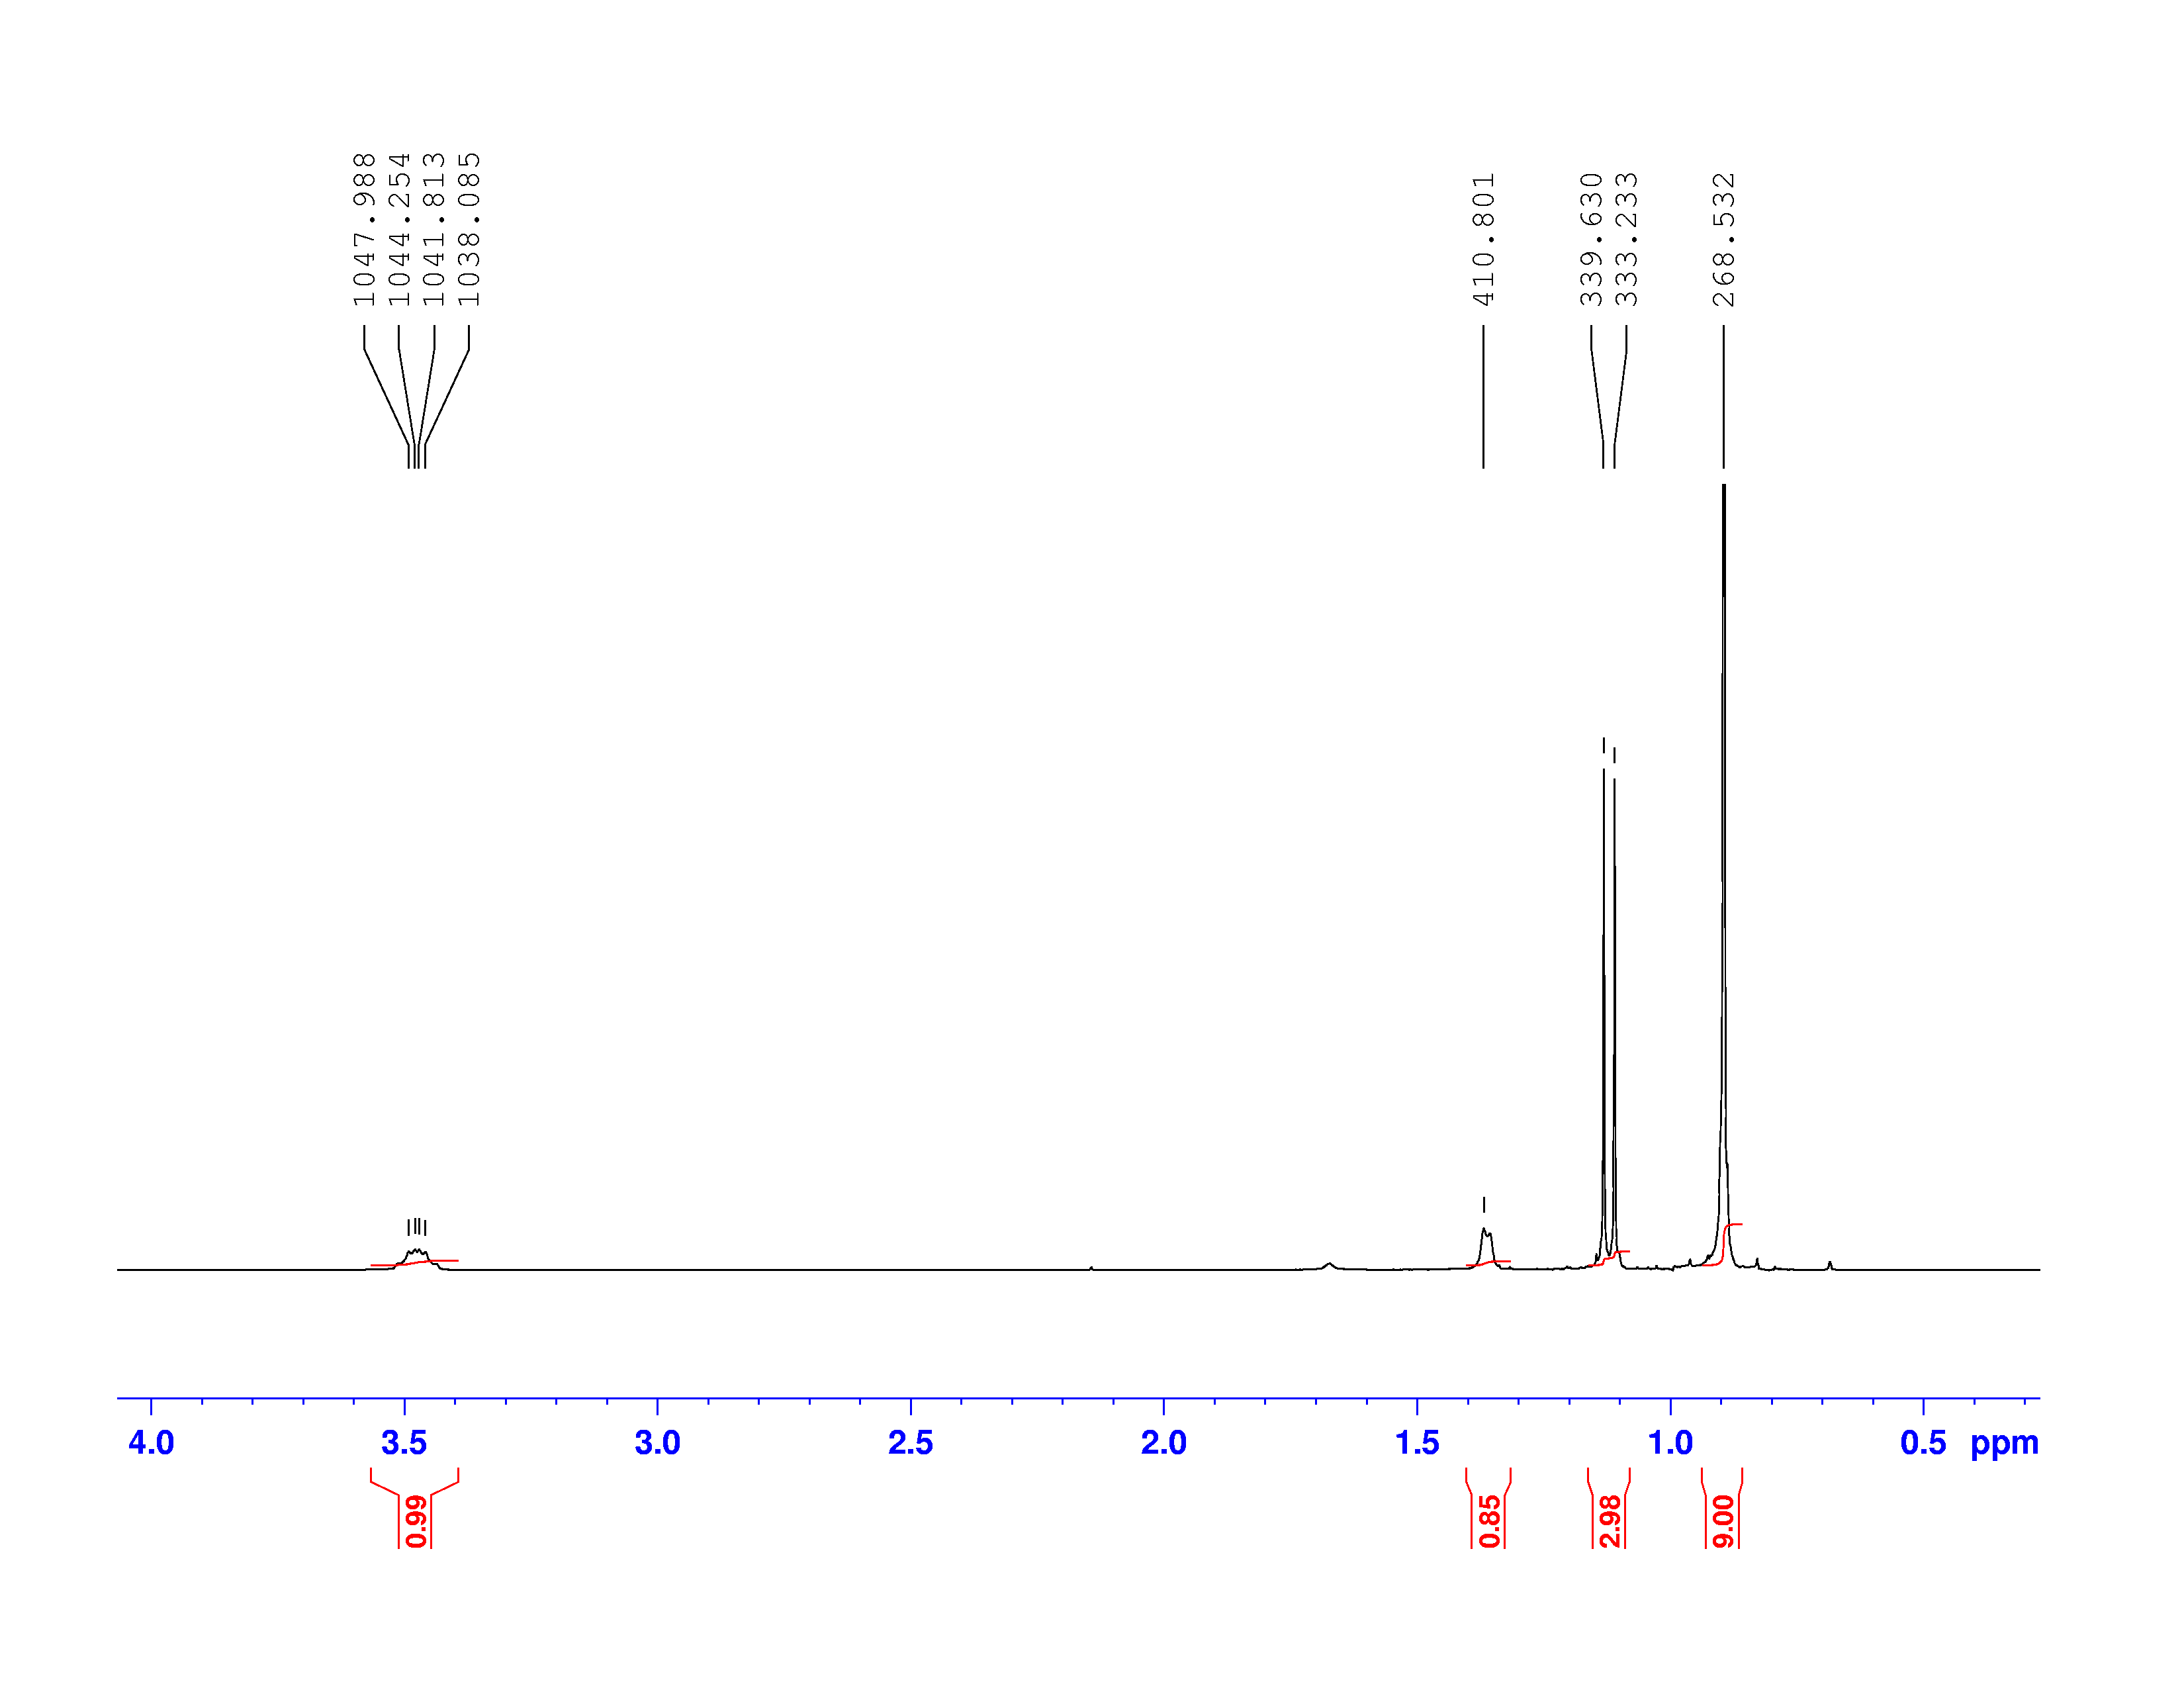
H-NMR and the ![]() C-NMR spectra, we can see how the results come together and give the structure of 3,3-dimethyl-2-butanol. Below we bring back the two figures that show the labeled hydrogens and carbons of the molecule:
C-NMR spectra, we can see how the results come together and give the structure of 3,3-dimethyl-2-butanol. Below we bring back the two figures that show the labeled hydrogens and carbons of the molecule:
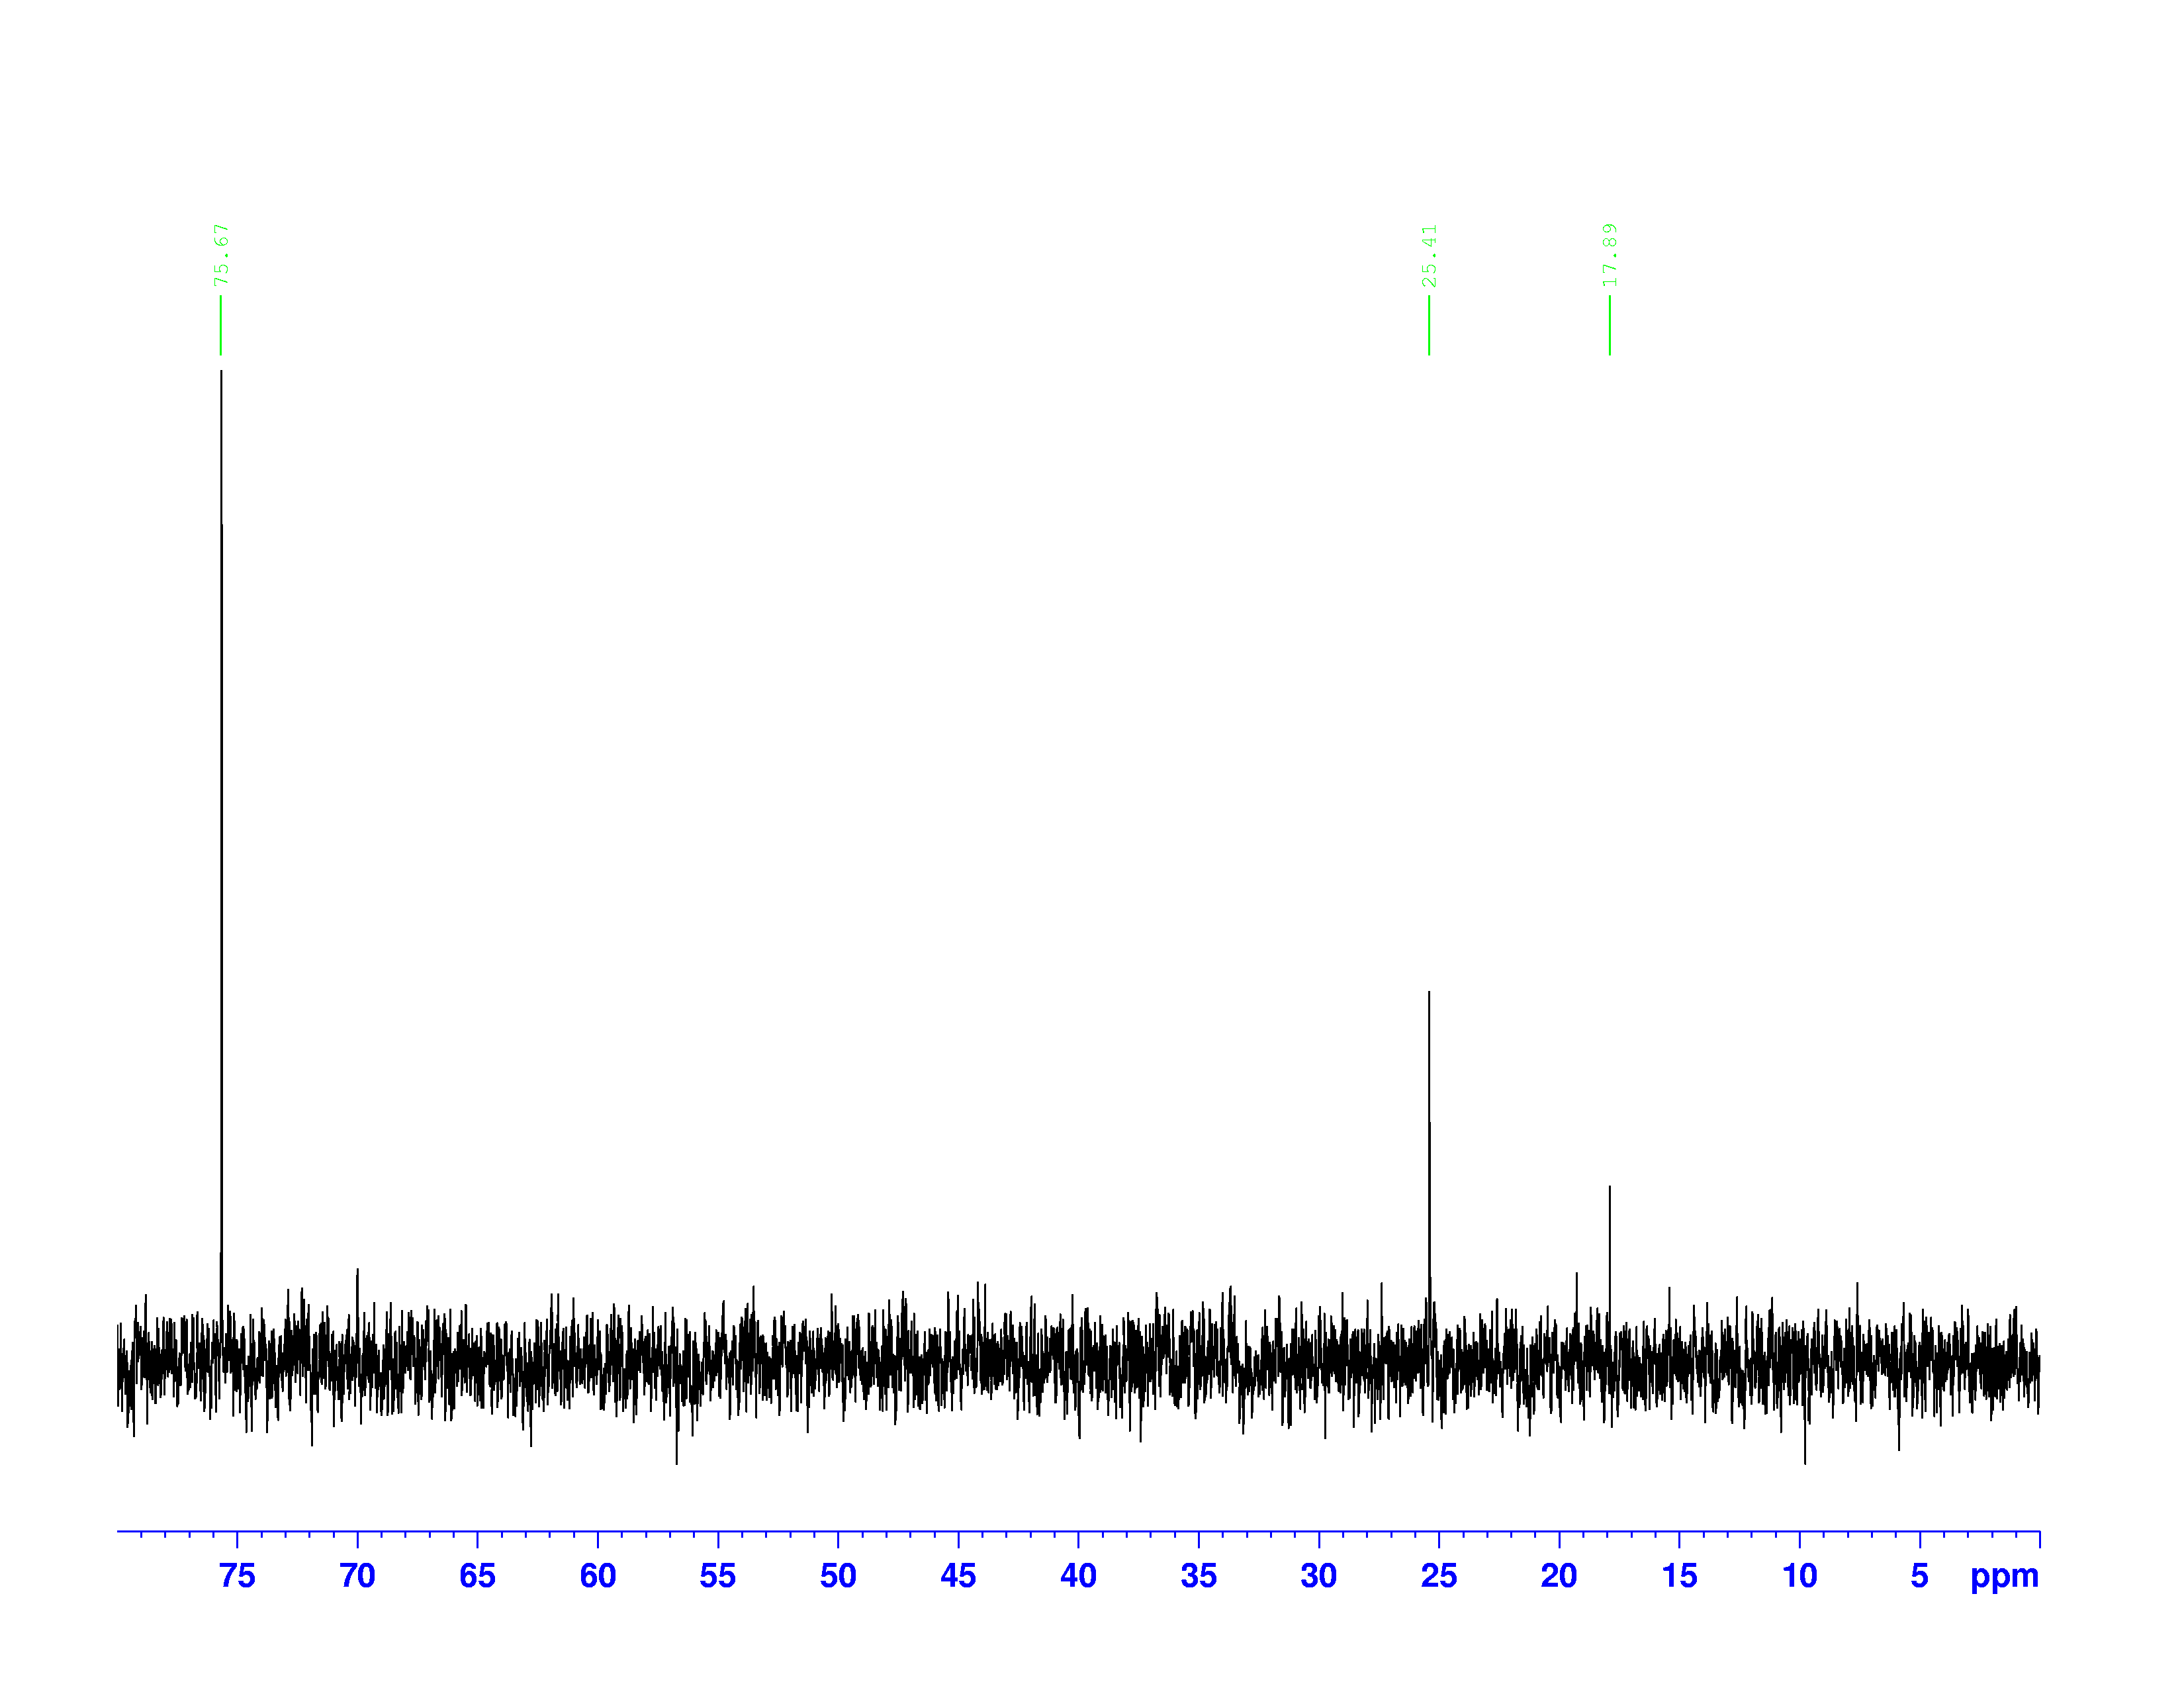
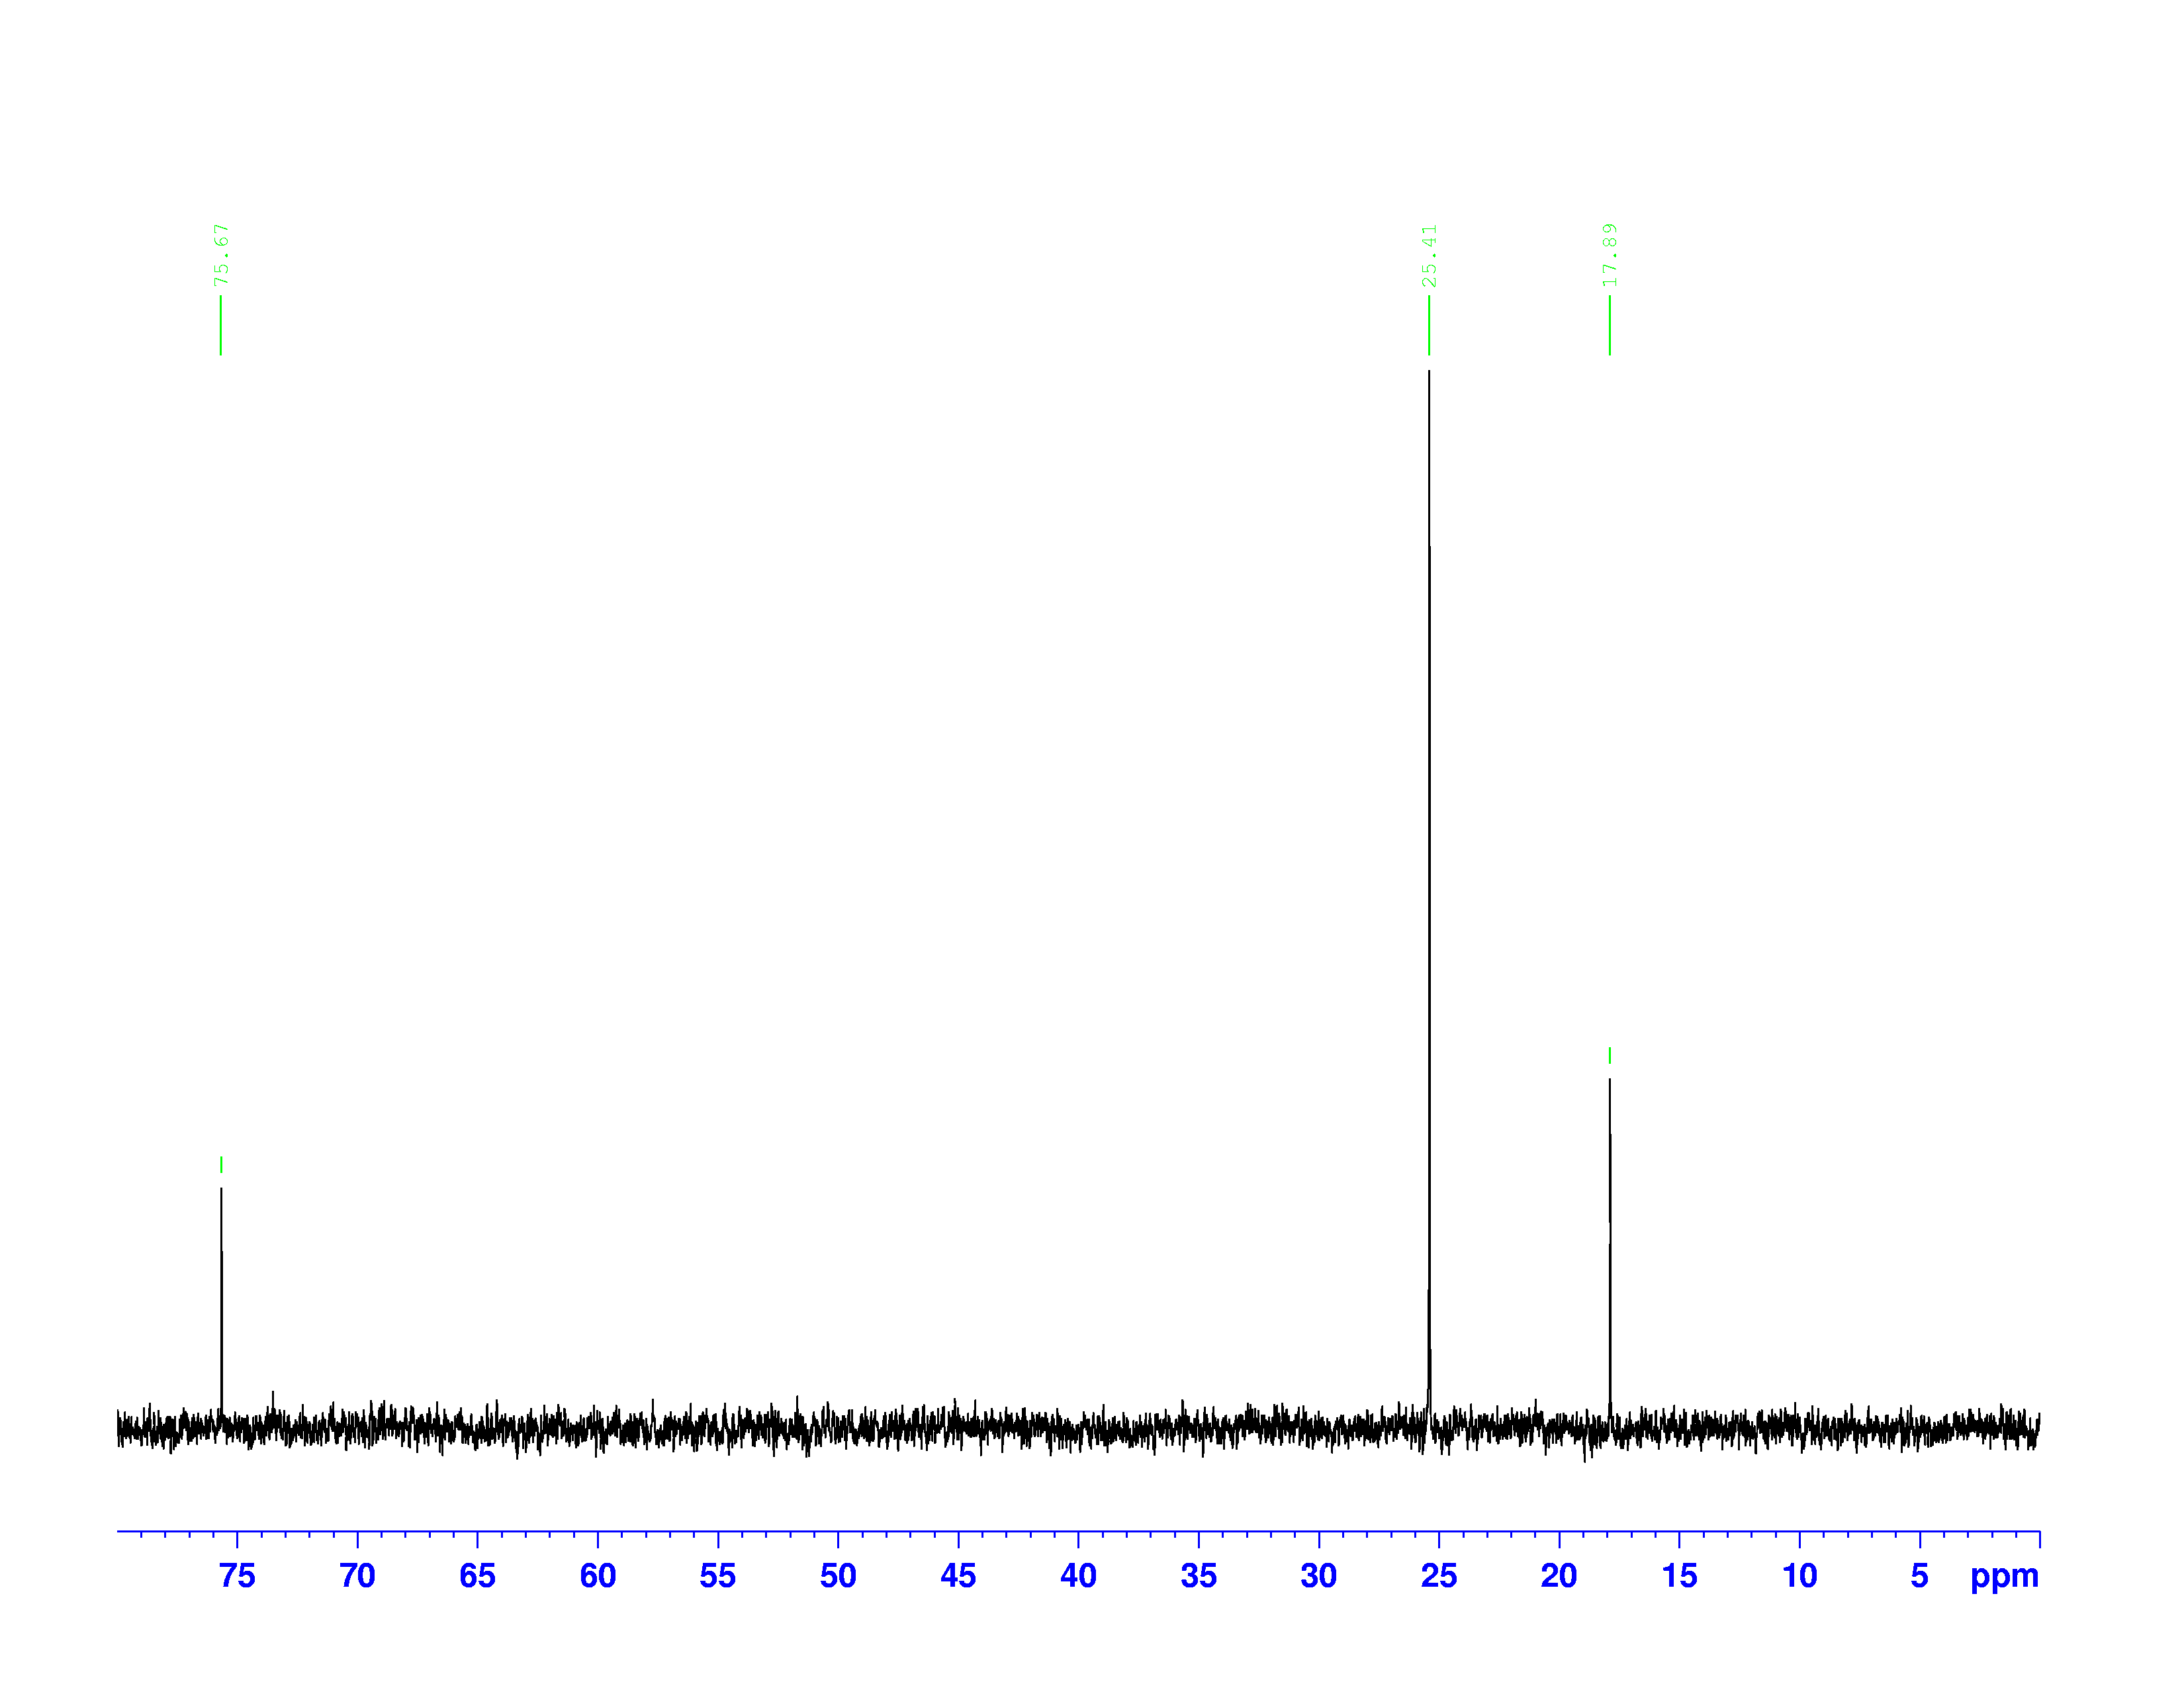
If we did not already know the identity of the molecule, we could have determined it using only the four spectra previously shown–the ![]() H-NMR, the
H-NMR, the ![]() C-NMR, the DEPT-90, and the DEPT-135–by following the guidelines laid out in the previous posts. Peaks on the four spectra work together to give bits of information about pieces of the molecule, and those pieces are put back together at the end of the analysis.
C-NMR, the DEPT-90, and the DEPT-135–by following the guidelines laid out in the previous posts. Peaks on the four spectra work together to give bits of information about pieces of the molecule, and those pieces are put back together at the end of the analysis.
To summarize, we began by taking advantage of the magnetic properties of ![]() H and
H and ![]() C nuclei to learn about the environment of each nucleus in the molecule. Radio waves were pulsed at the sample to record small changes in the resonant Larmor frequency of the nuclei. The change happened because electrons around each nucleus became a current when influenced by the NMR’s external field, and generated their own fields in the opposite direction according to Lenz’s Law. This new, effective magnetic field resulted in changes in the Larmor frequency of each nucleus. It is these changes that are displayed on the spectra as chemical shifts. The chemical shift is measured in ppm of the original Larmor frequency of the nucleus.
C nuclei to learn about the environment of each nucleus in the molecule. Radio waves were pulsed at the sample to record small changes in the resonant Larmor frequency of the nuclei. The change happened because electrons around each nucleus became a current when influenced by the NMR’s external field, and generated their own fields in the opposite direction according to Lenz’s Law. This new, effective magnetic field resulted in changes in the Larmor frequency of each nucleus. It is these changes that are displayed on the spectra as chemical shifts. The chemical shift is measured in ppm of the original Larmor frequency of the nucleus.
Using the Larmor frequency equation below, and the shifted frequencies, we calculated the shielding factor ![]() for each nucleus. The shielding factor is another measure of the relative electron density around each nucleus.
for each nucleus. The shielding factor is another measure of the relative electron density around each nucleus.
(1) ![]()
Combining the information from the spectra gives the structure of 3,3-dimethyl-2-butanol, which is shown again below.


