Project Proposal
Nuclear magnetic resonance is a technique for determining the structure of organic molecules in solution. It takes advantage of the magnetic properties of the nucleus to sense the proximity of double bonds, electronegative atoms like oxygen, and other magnetic nuclei in the molecular structure. The technique can identify these bond types and functional groups in a molecule. The same principles this project will study apply in MRI (Magnetic Resonance Imaging) machines that create detailed images of a medical patient without using dangerous, ionizing radiation. An NMR spectrometer is a scaled-down MRI designed to look at small samples of a substance dissolved in solution [1].
The magnetic field generated by an NMR spectrometer, and the effective field experienced by a nucleus will be modeled. These field’s effects on atomic nuclei will be studied and modeled. The shim system, which is the process by which the magnetic field is homogenized, will also be explained.
The Larmor frequency is the resonant frequency of a given nucleus and is only dependent on the strength of the external magnetic field, and the magnet strength of the nucleus. It is this frequency that allows us to select what elements to analyze in a given test. The following equation is used to calculate a Larmor frequency [1]:
(1) 
where  is the Larmor frequency,
  is the magnetogyric ratio, or nuclear magnet strength, and
  is the effective magnetic field strength. The effective magnetic field strength is given by the following equation [1]:
(2) 
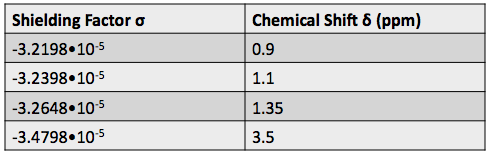
where  is the external magnetic field strength and
  is the shielding factor. When the atom is polarized and stretched by a magnetic field, a small magnetic field is generated in the opposite direction, in accordance with Lenz’s Law, that also affects the nucleus. The shielding factor is a direct measurement of electron density around a nucleus, and is important because the electron density determines the effect of the external magnetic field on the nucleus: more electron density causes less of an effect, and vice-versa. The resonant frequency can then be rewritten to show the dependence of frequency on external magnetic field strength:
(3) 
Most of the information from NMR comes from the chemical shift, which is the change in a nucleus’ resonant frequency as the external magnetic field’s influence on the nucleus increases or decreases. To standardize the results of NMR experiments, we express the chemical shift in parts-per-million so it is the same regardless of how powerful the instrument’s magnet is. The formula for chemical shift is [1]:
(4) 
where  is the chemical shift, and
  is the reference shielding factor used to define the zero-point of the chemical shift scale. It is most often the shielding factor for a compound called tetramethylsilane, or TMS, because of the peak’s consistent and reliable strength and shape.
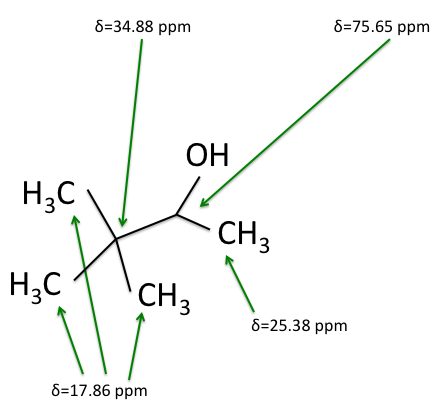
There are four experiments in particular that are performed using NMR. 1H-NMR focuses on hydrogen nuclei, while 13C-NMR, DEPT-90, and DEPT-135 focus on 13C nuclei. They are so widely used because most organic molecules are made primarily of hydrogen and carbon atoms, so much information can be gleaned these four spectra. To that end, these four tests will be performed on 3,3-dimethyl-2-butanol
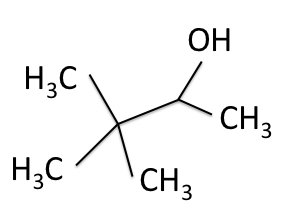
Figure 1: 3,3-dimethyl-2-butanol
Mathematica, Wolfram Alpha, Excel and the NMR software Topspin will be used in the study and to create figures. The book “NMR Spectroscopy Explained” by Neil E. Jacobsen will be used as the primary theoretical tool. Karen Wovkulich, the Chemistry Instrumentation Manager at Vassar College, will also be consulted.
References:
1) Jacobsen, Neil E. NMR Spectroscopy Explained: Simplified Theory, Applications and Examples for Organic Chemistry and Structural Biology. Hoboken, NJ: Wiley-Interscience, 2007. Print.


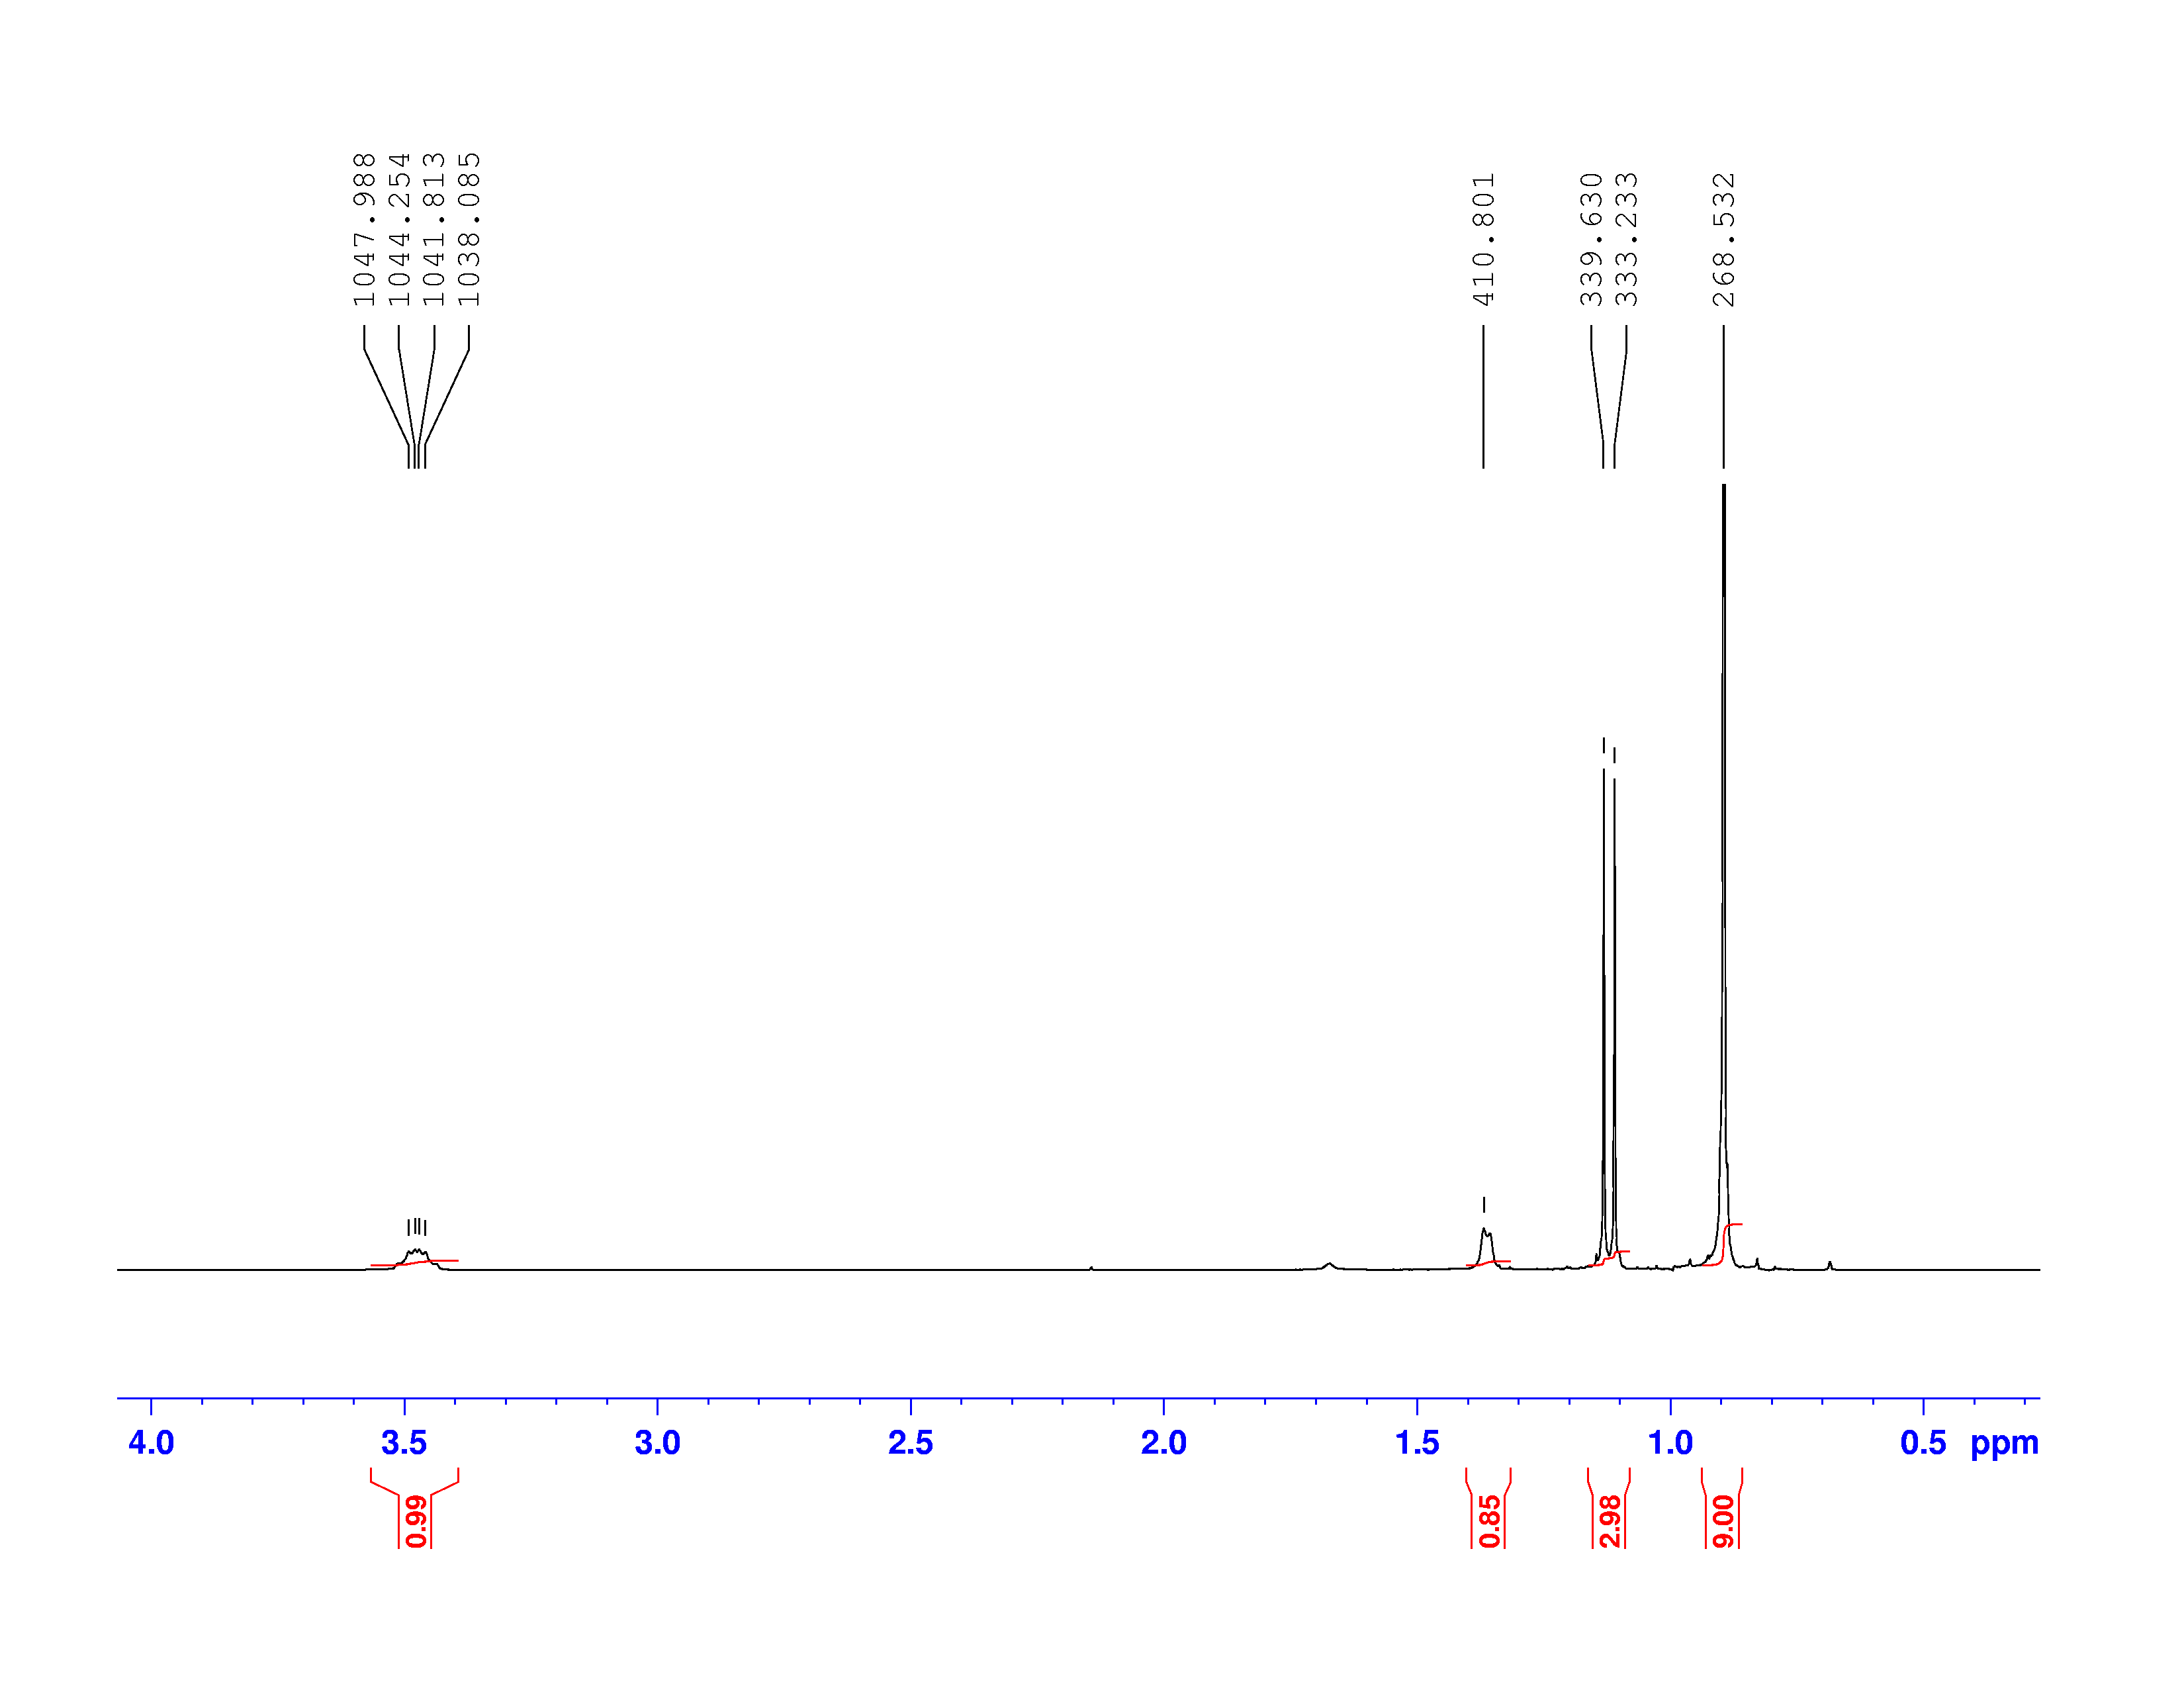
 H-NMR and the
  C-NMR spectra, we can see how the results come together and give the structure of 3,3-dimethyl-2-butanol. Below we bring back the two figures that show the labeled hydrogens and carbons of the molecule:


 is 300 MHz.
  magnetic field. According to Jacobsen in “NMR Spectroscopy Explained,” the Larmor frequency of unaltered
  We bring back the equation for Larmor Frequency:
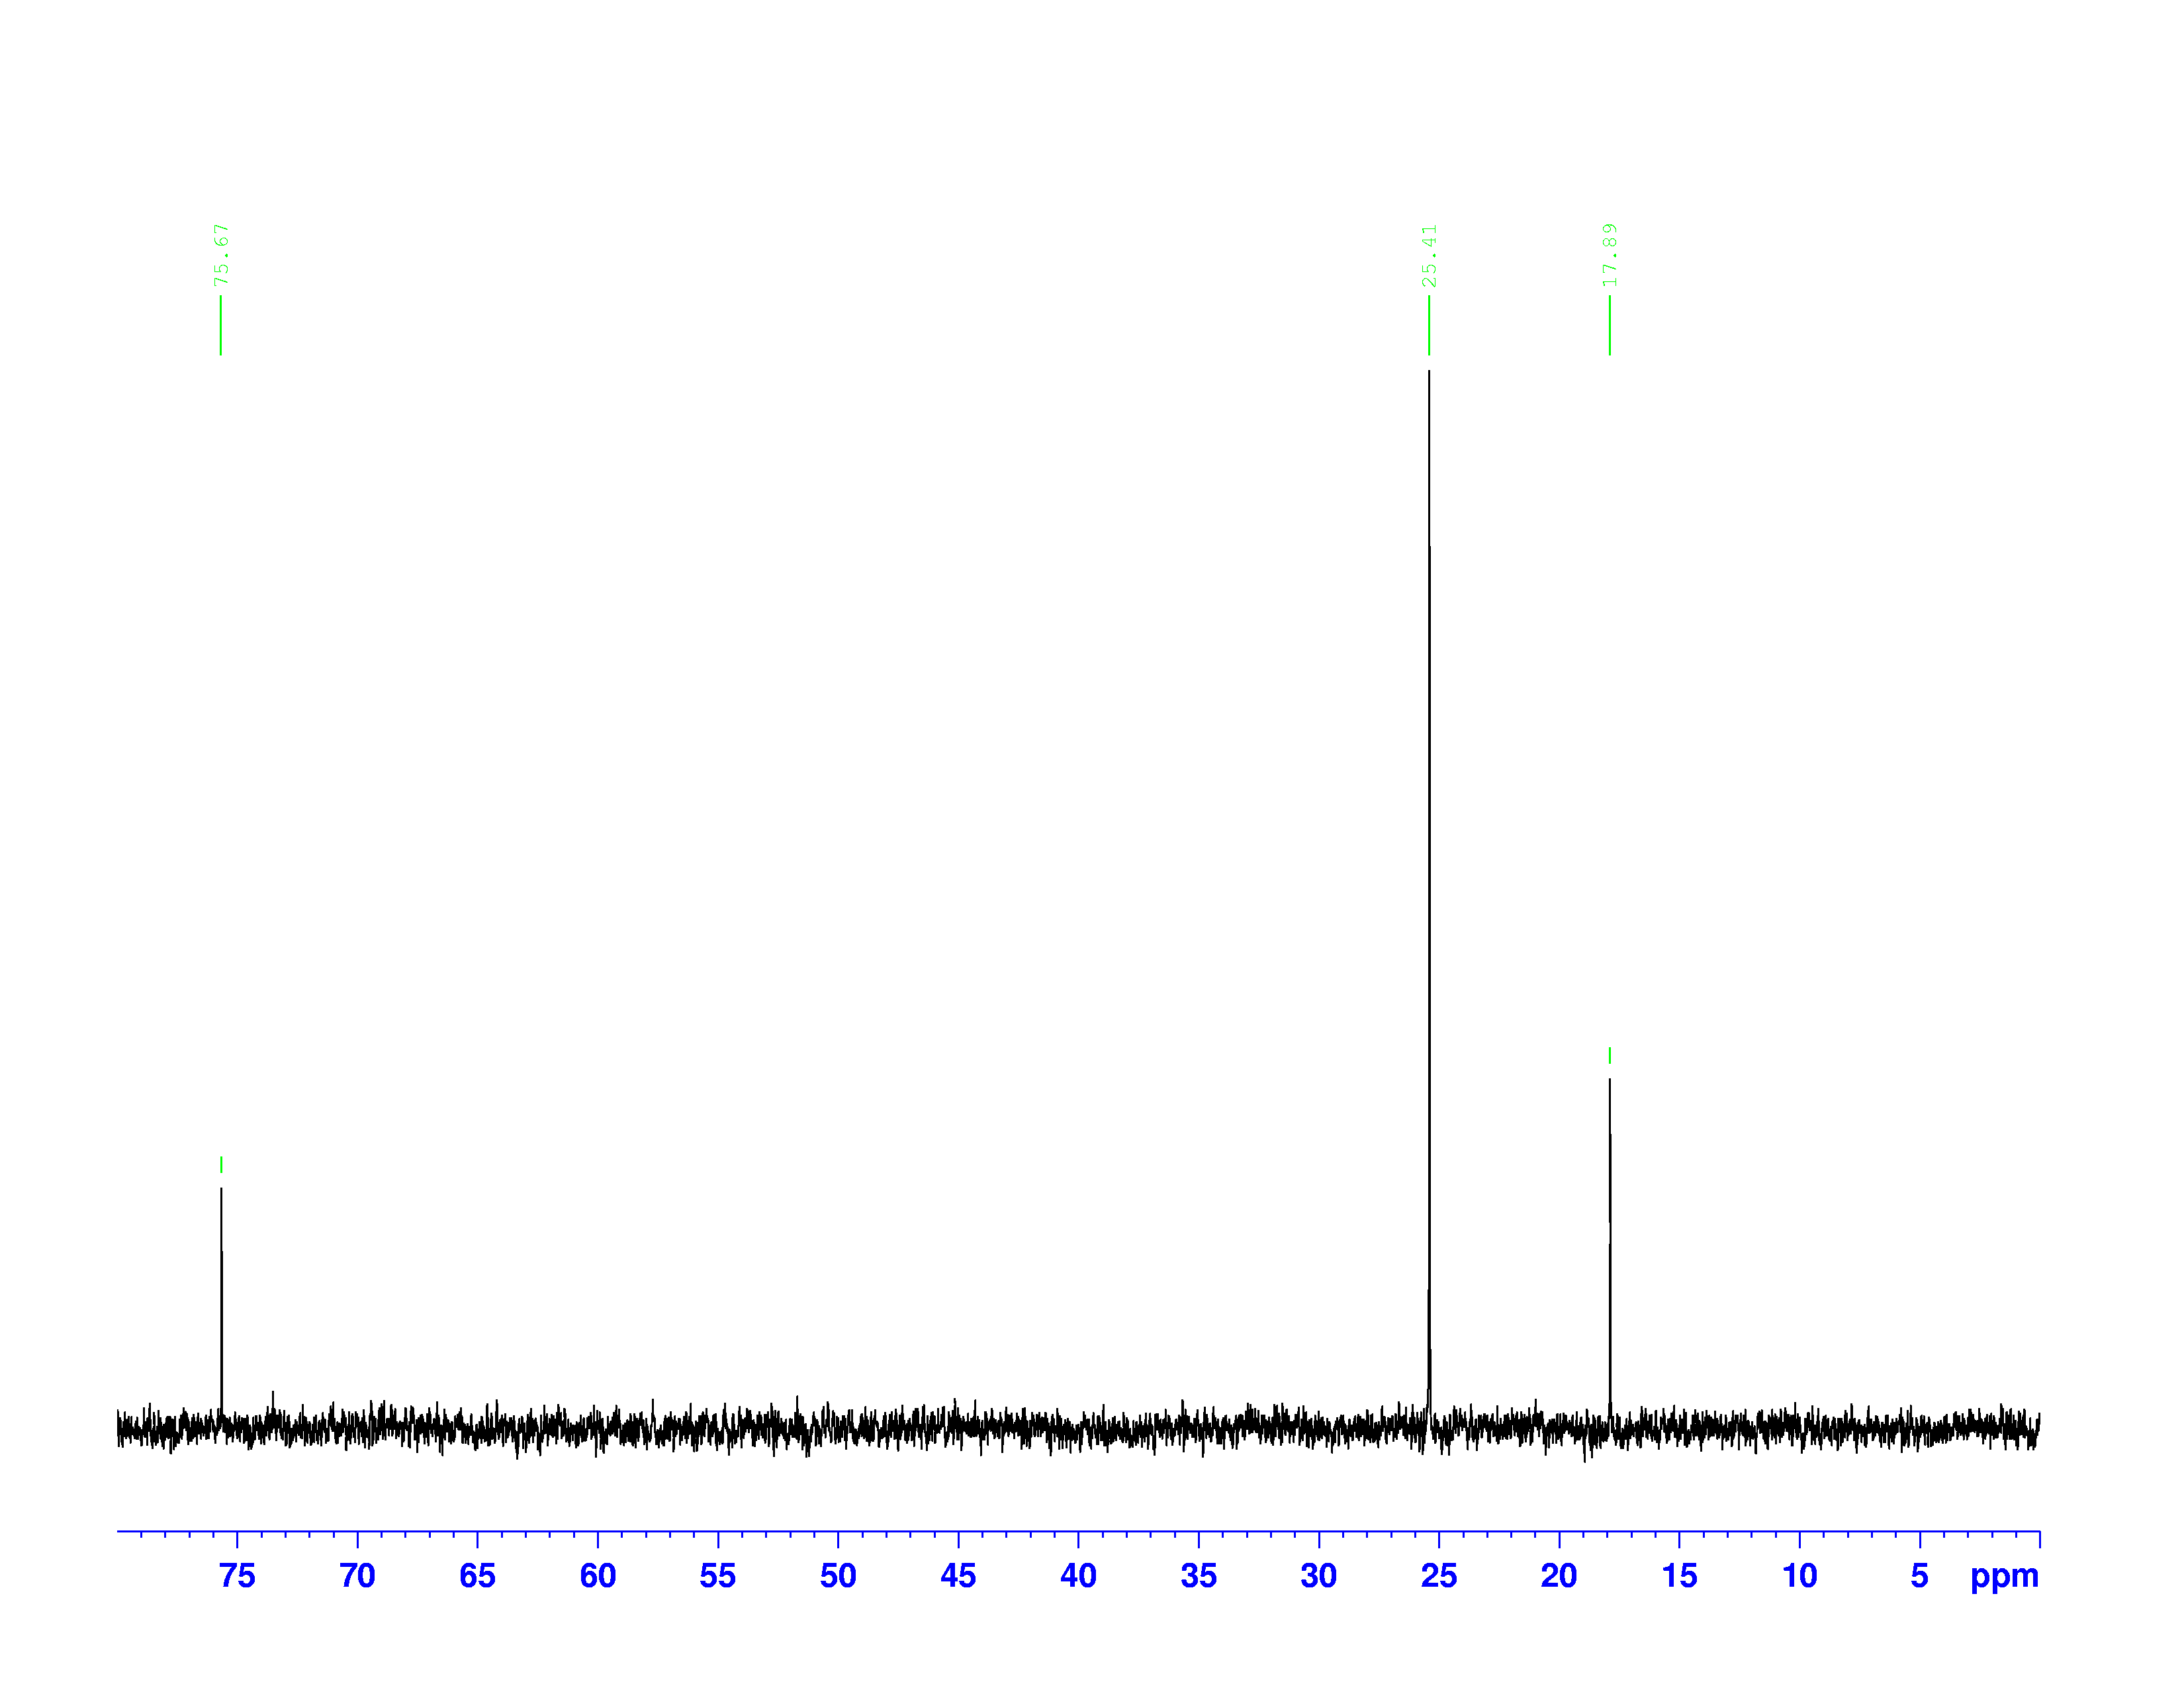
 C nuclei. It comes down to the composition of the nucleus. Only nuclei with nonzero spin are magnetically active. Spin is a type of angular momentum intrinsic to subatomic particles. Particles with nonzero spin can have magnetic moments that can be influenced by a magnetic field. Any nucleus with an even number of protons and an even number of neutrons will not be magnetically active because its spin is 0 and it has no magnetic moment. Carbon-12 has 6 protons and 6 neutrons, so it can’t be studied with NMR. Carbon-13 has 6 protons and 7 neutrons, so we can study it with NMR. The structure and
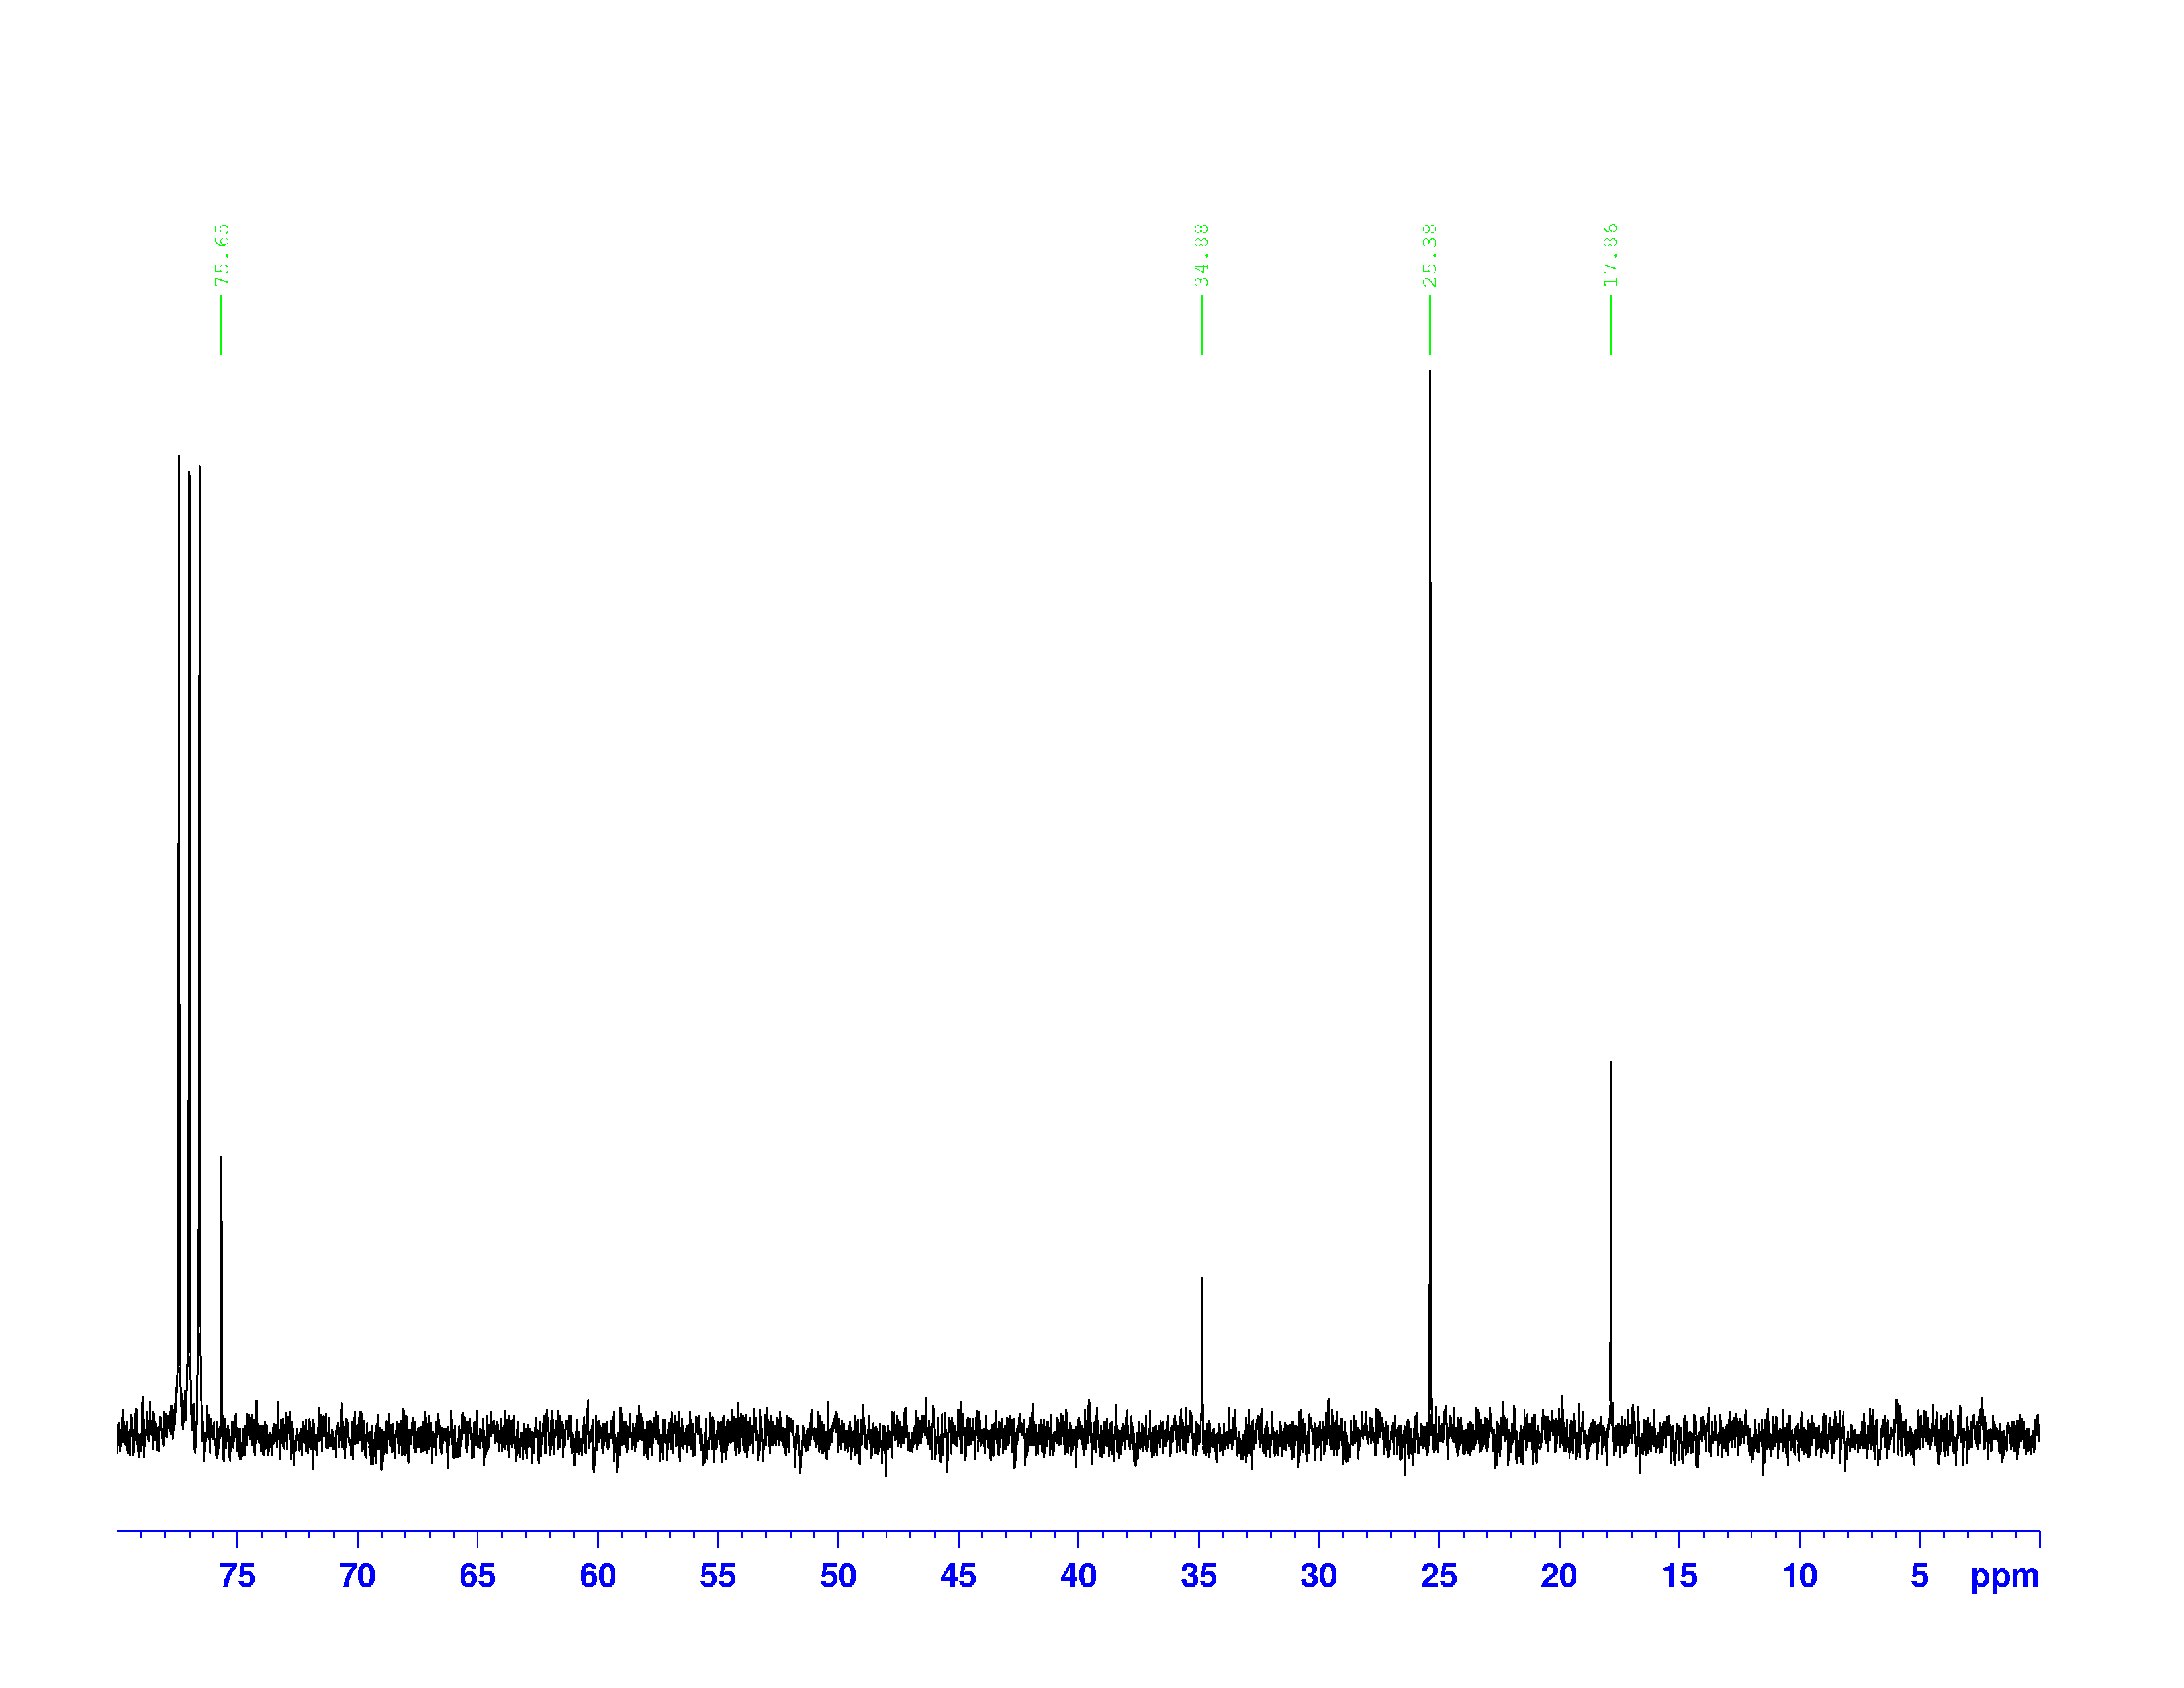
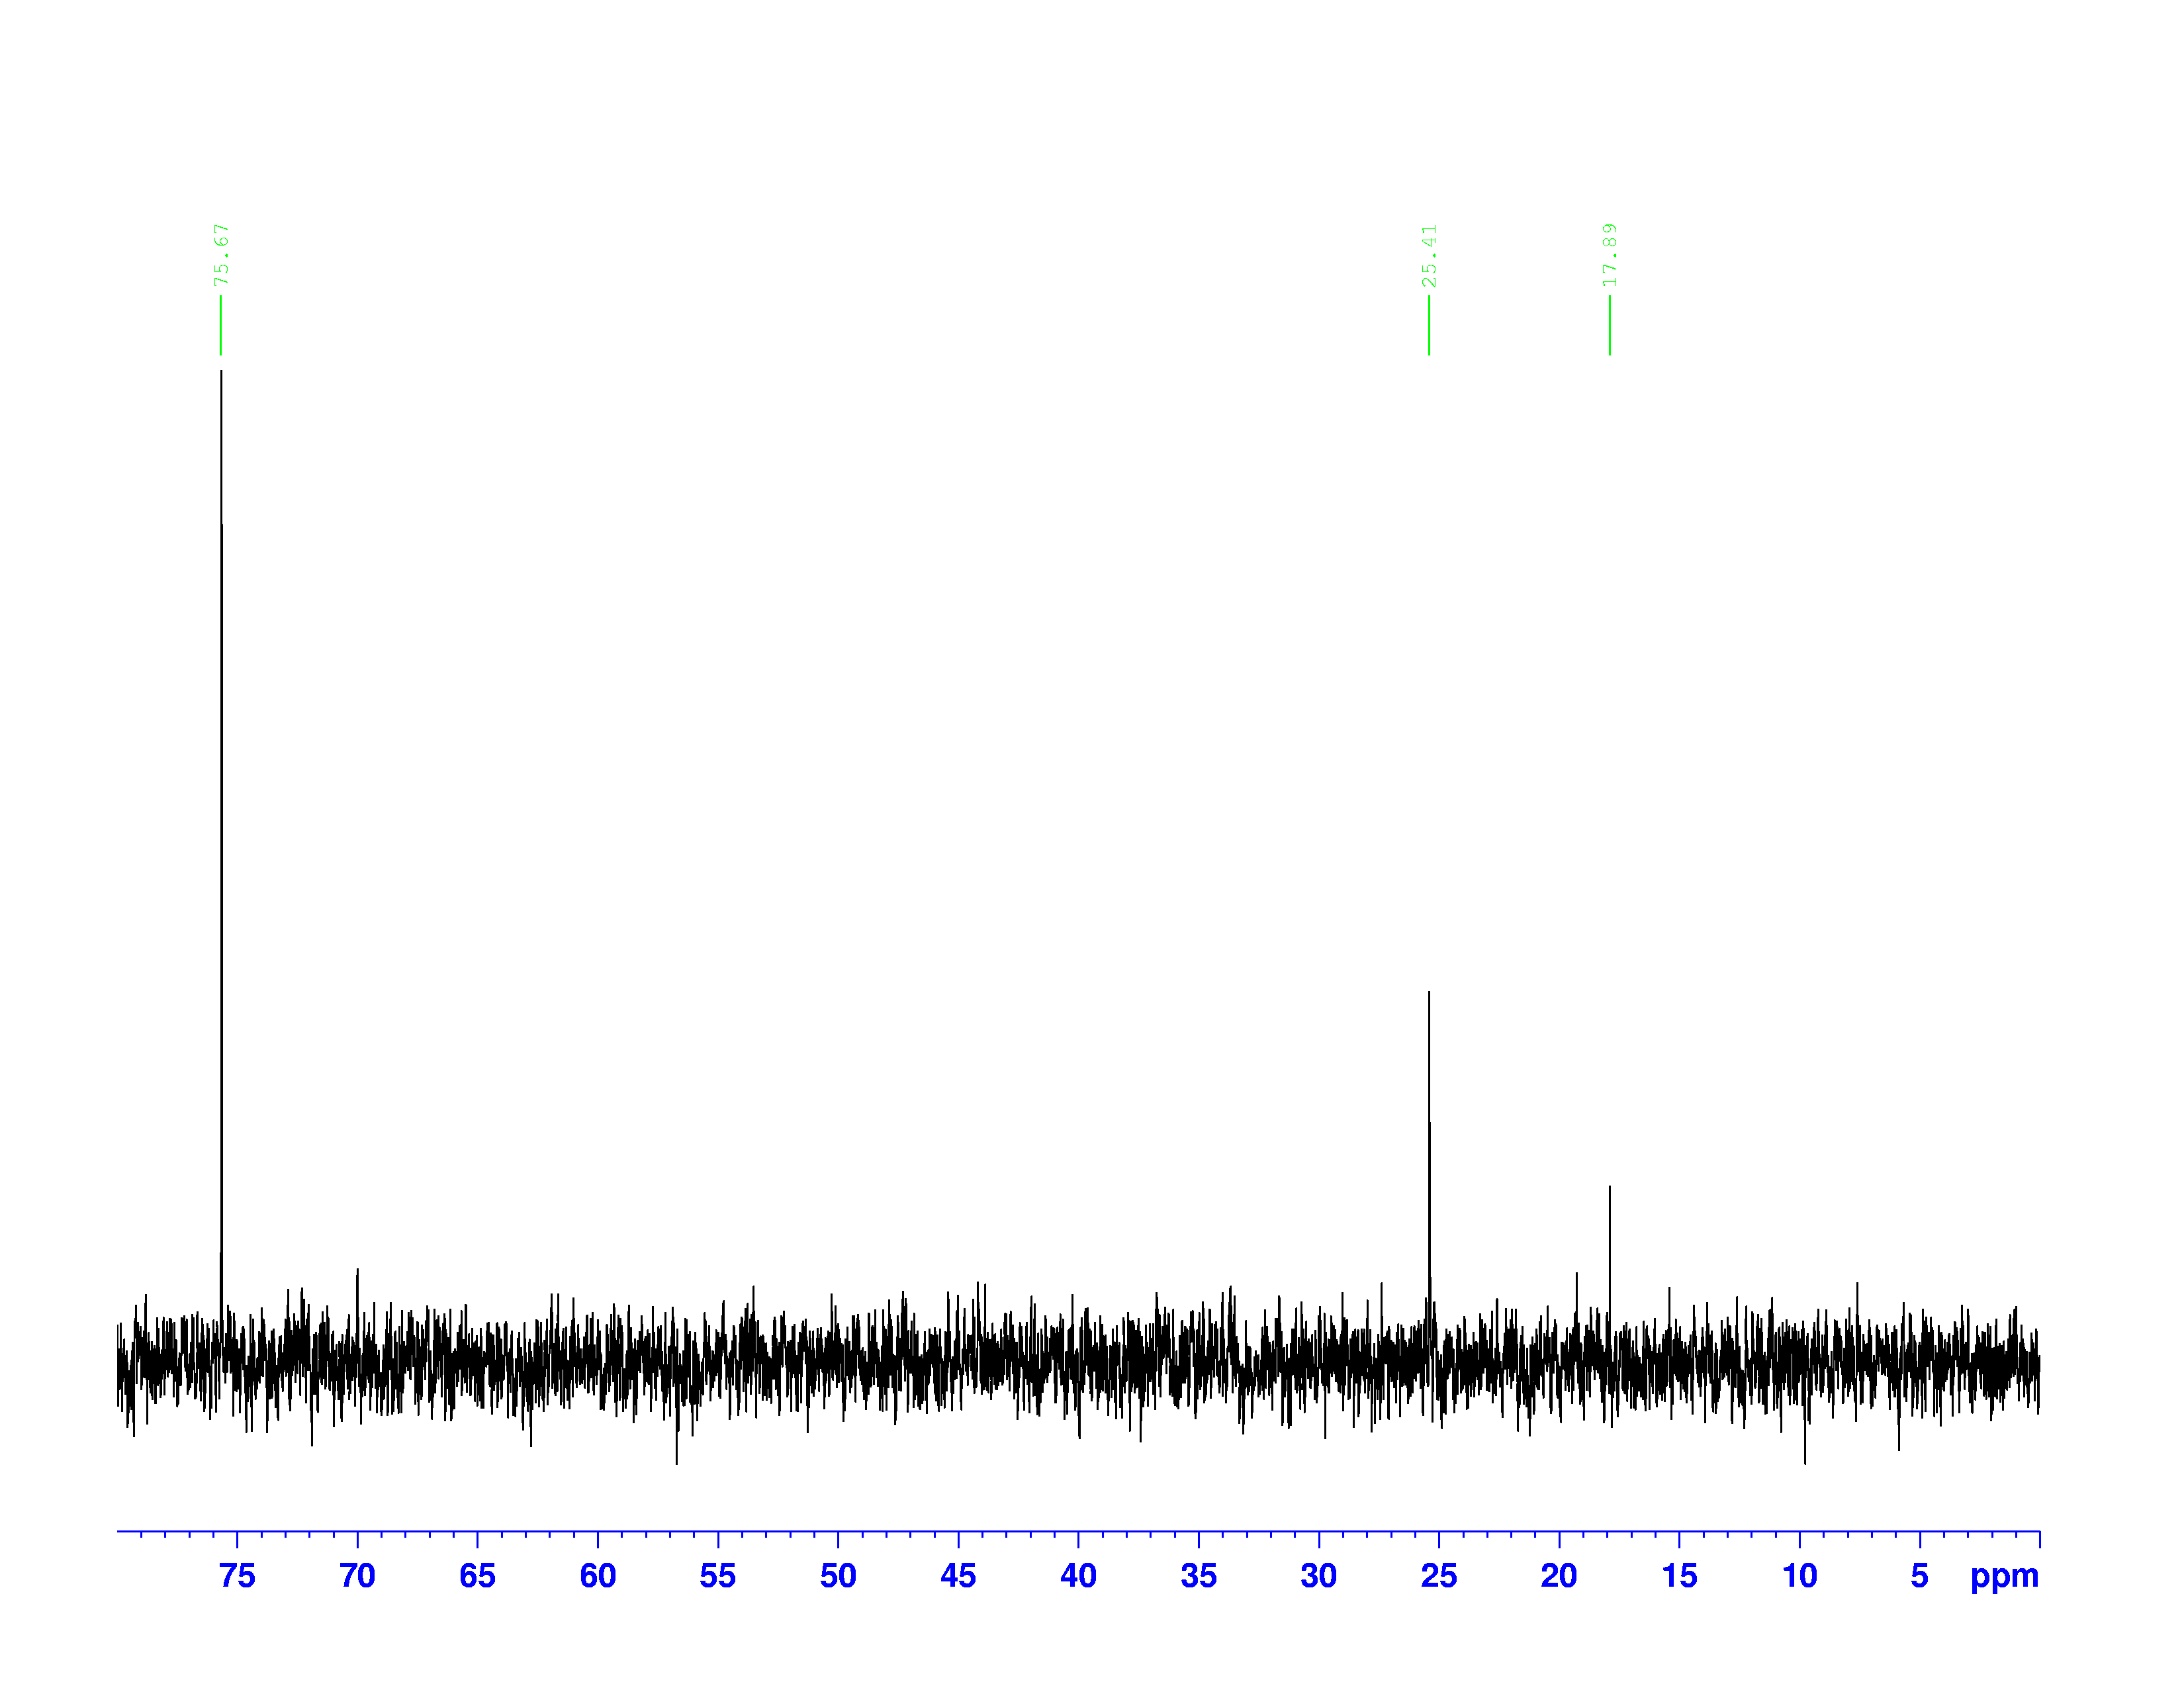
 , used to dissolve the sample. Excluding that triplet, the molecule has four different kinds of carbon. To help us find what carbons are represented here, we turn to the other two spectra of interest. They are called the DEPT-90, and the DEPT 135. DEPT stands for Distortionless Enhancement by Polarization Transfer. The technique hits the sample with five successive radio pulses designed to excite either hydrogen or
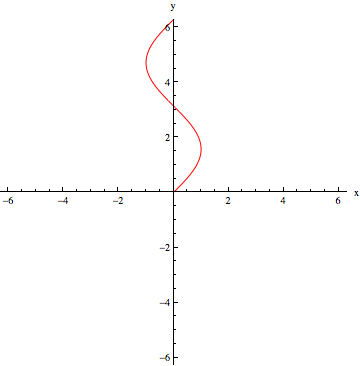


 . A quick calculation using:


 , where
  is the number of peaks. The definition of “nearby” is usually 1 carbon atom over in the molecule from the one the original hydrogen is attached to.
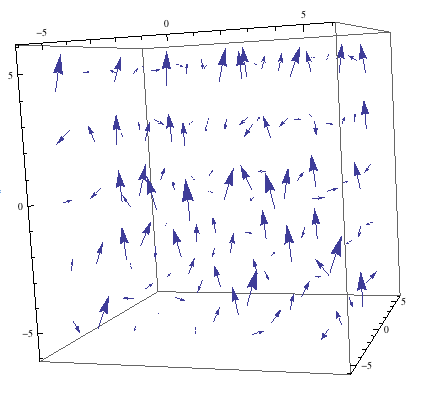
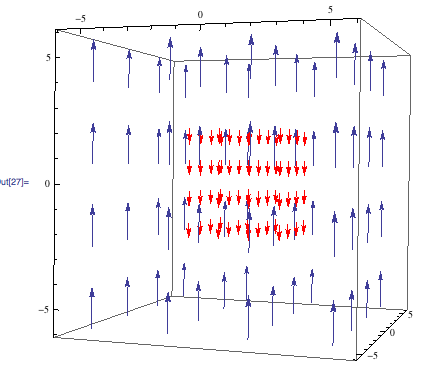
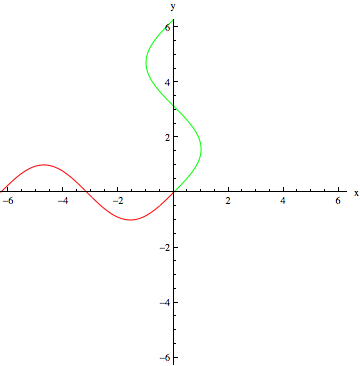
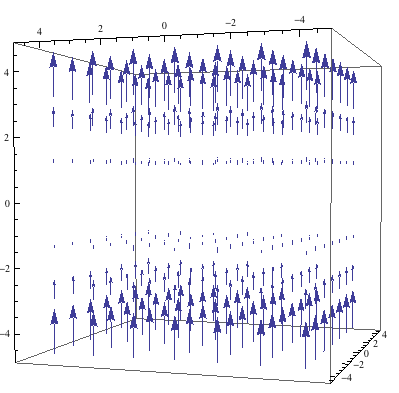
 are available to add to the magnetic field created by shimming. Each set of coils creates a magnetic field gradient in its direction. Below is a model of a correction field that uses the function
  :
:
 and
and