The magnetic field inside an NMR spectrometer is generated by a superconducting solenoid. The solenoid is cooled by a three-layer cooling system. The outer layer is one of liquid nitrogen at 77K. The middle layer is an evacuated cavity that prevents heat conduction by air. The innermost layer contains the solenoid submerged in 4K liquid helium that is kept below atmospheric pressure. Initially, the magnetic field in an NMR will not be homogenous because of interferences resulting from the magnetization of the sample, and environmental interferences like iron or other metals used in construction.
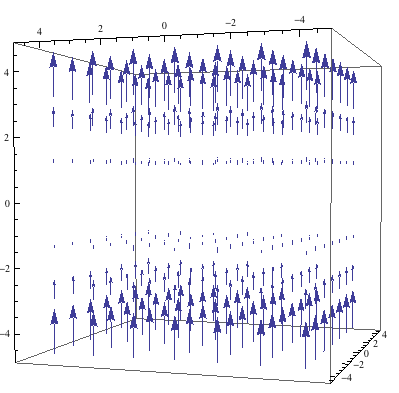
Initial NMR Magnetic Field
Sample NMR Starting Magnetic Field
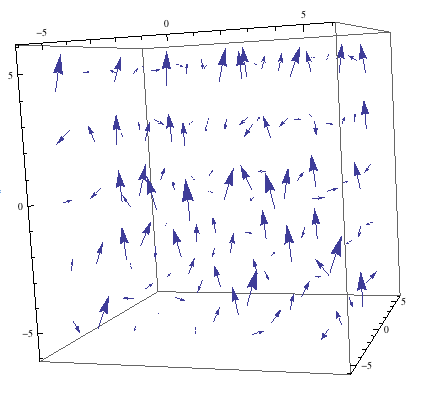
Note the somewhat ordered field that already exists in the Z-direction. This is what the initial field looks like most of the time: the inhomogeneities are a complex function in three dimensions. In order to make the magnetic field homogenous, it is modified using the shim system. The shim system is a series of uncooled, current carrying coils that generate fields in all three directions. Each coil attempts to create a field with a function that precisely cancels the imperfections. Numerous simple 3-D functions like ![]() are available to add to the magnetic field created by shimming. Each set of coils creates a magnetic field gradient in its direction. Below is a model of a correction field that uses the function
are available to add to the magnetic field created by shimming. Each set of coils creates a magnetic field gradient in its direction. Below is a model of a correction field that uses the function ![]() :
:
![]() Correction Field
Correction Field
All but the most experienced and exacting users of NMR use functions other than ![]() and
and ![]() in the correction field because the original field is usually close to homogenous. The optimal field for doing NMR spectroscopy is shown below-it is perfectly homogenous and only in the Z-direction.
in the correction field because the original field is usually close to homogenous. The optimal field for doing NMR spectroscopy is shown below-it is perfectly homogenous and only in the Z-direction.
Optimal NMR Magnetic Field
Once the magnetic field is homogenized, the analysis of a sample can begin. Each nucleus in the atom to be tested has its own resonant frequency somewhere in the radio section of the electromagnetic spectrum. NMR takes advantage of this frequency’s dependence on the strength on an external magnetic field to gather information about each single nucleus, all at one time. When the sample is placed in the now-homogenized magnetic field, the electrons around each nucleus become a current, and generate their own magnetic field in the opposite direction. This effect is shown below, where the field of the NMR is blue, and the field created by the sample is red.
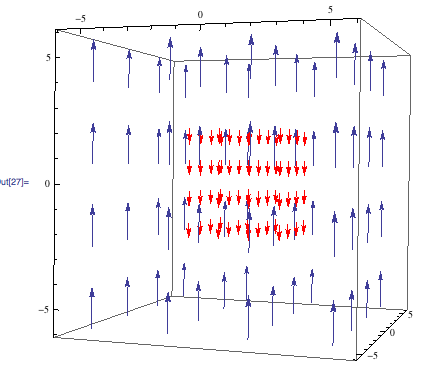 Magnetic field generated by a sample
The smaller, red magnetic field decreases the influence of the NMR’s magnetic field on each nucleus and causes a very small shift in their resonant frequencies. These shifts, which are dependent on the electron density around each nucleus, are calculated using the equation:
(1) ![]()
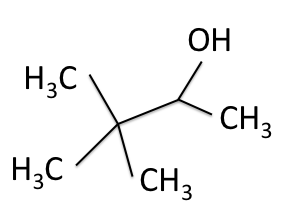
The peaks that appear on NMR spectra are created when radio waves that match the now-altered resonant frequencies are absorbed and reradiated by the nuclei. The four NMR spectra collected for 3,3-dimethyl-2-butanol are shown below as a sample of the gathered data.

![]() H-NMR Spectrum of 3,3-dimethyl-2-butanol
H-NMR Spectrum of 3,3-dimethyl-2-butanol
Each peak in a ![]() H-NMR spectrum represents a certain number of hydrogen nuclei and describes their neighborhood in the molecule.
H-NMR spectrum represents a certain number of hydrogen nuclei and describes their neighborhood in the molecule.
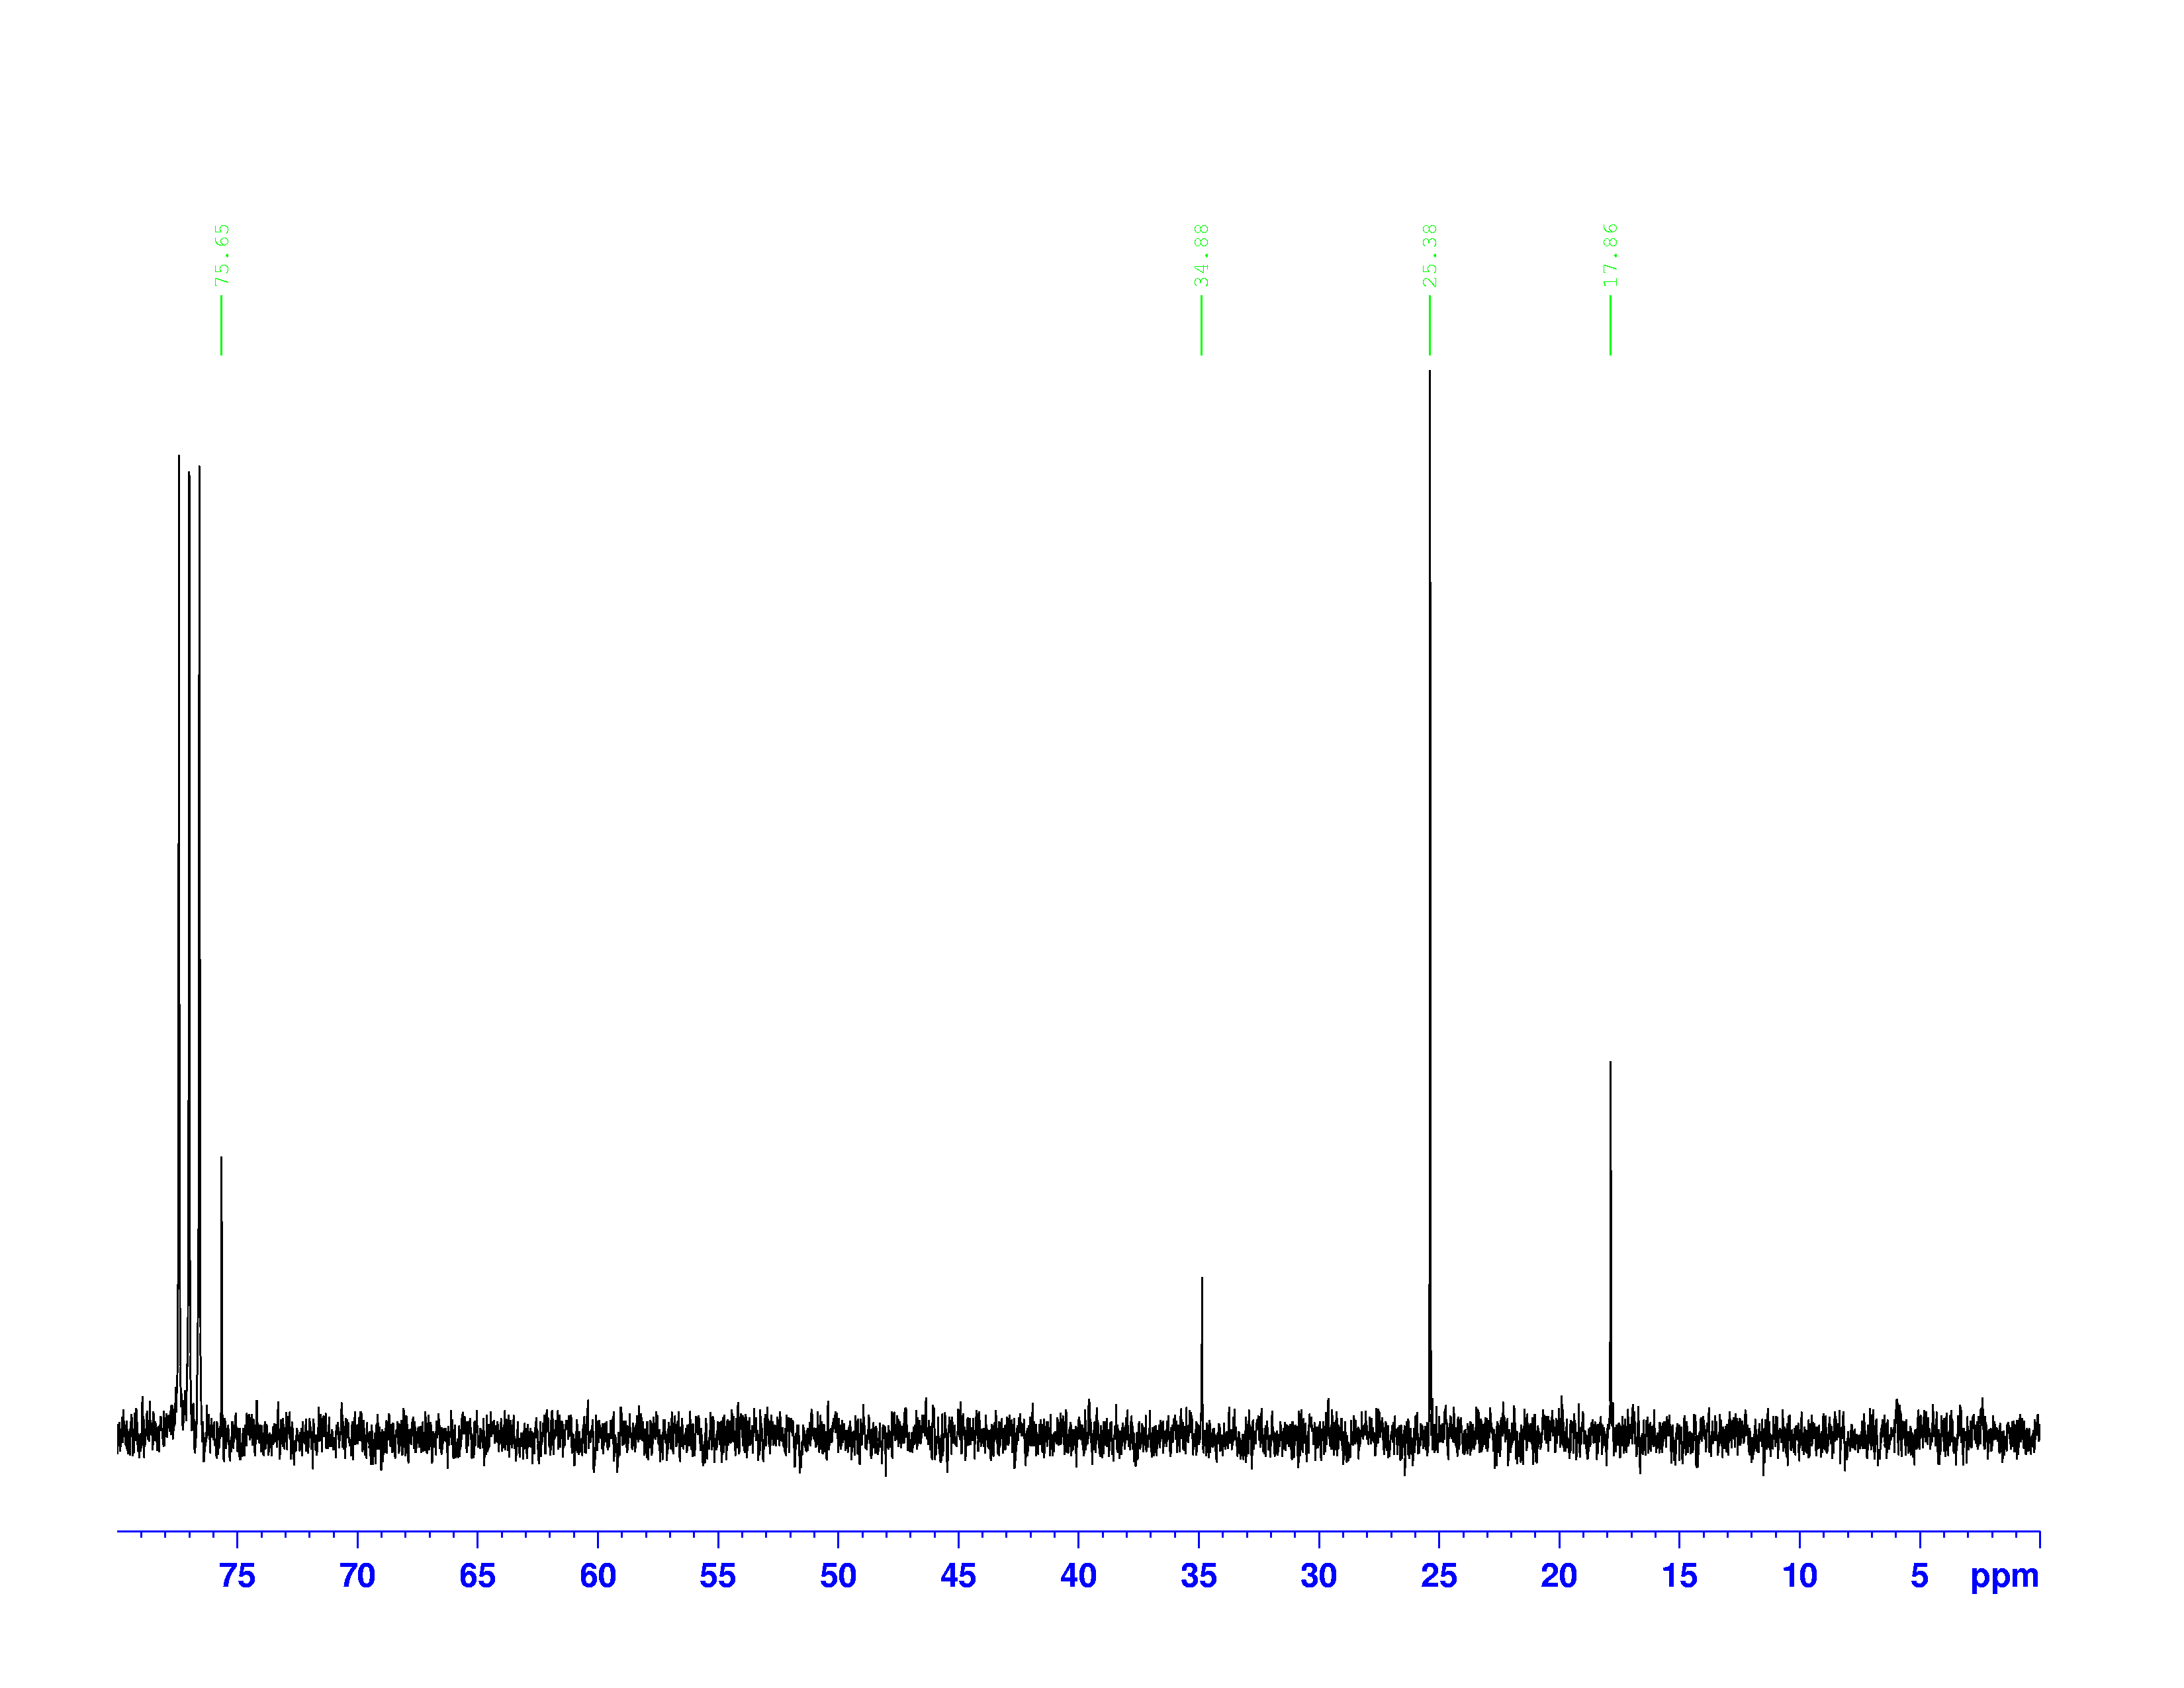
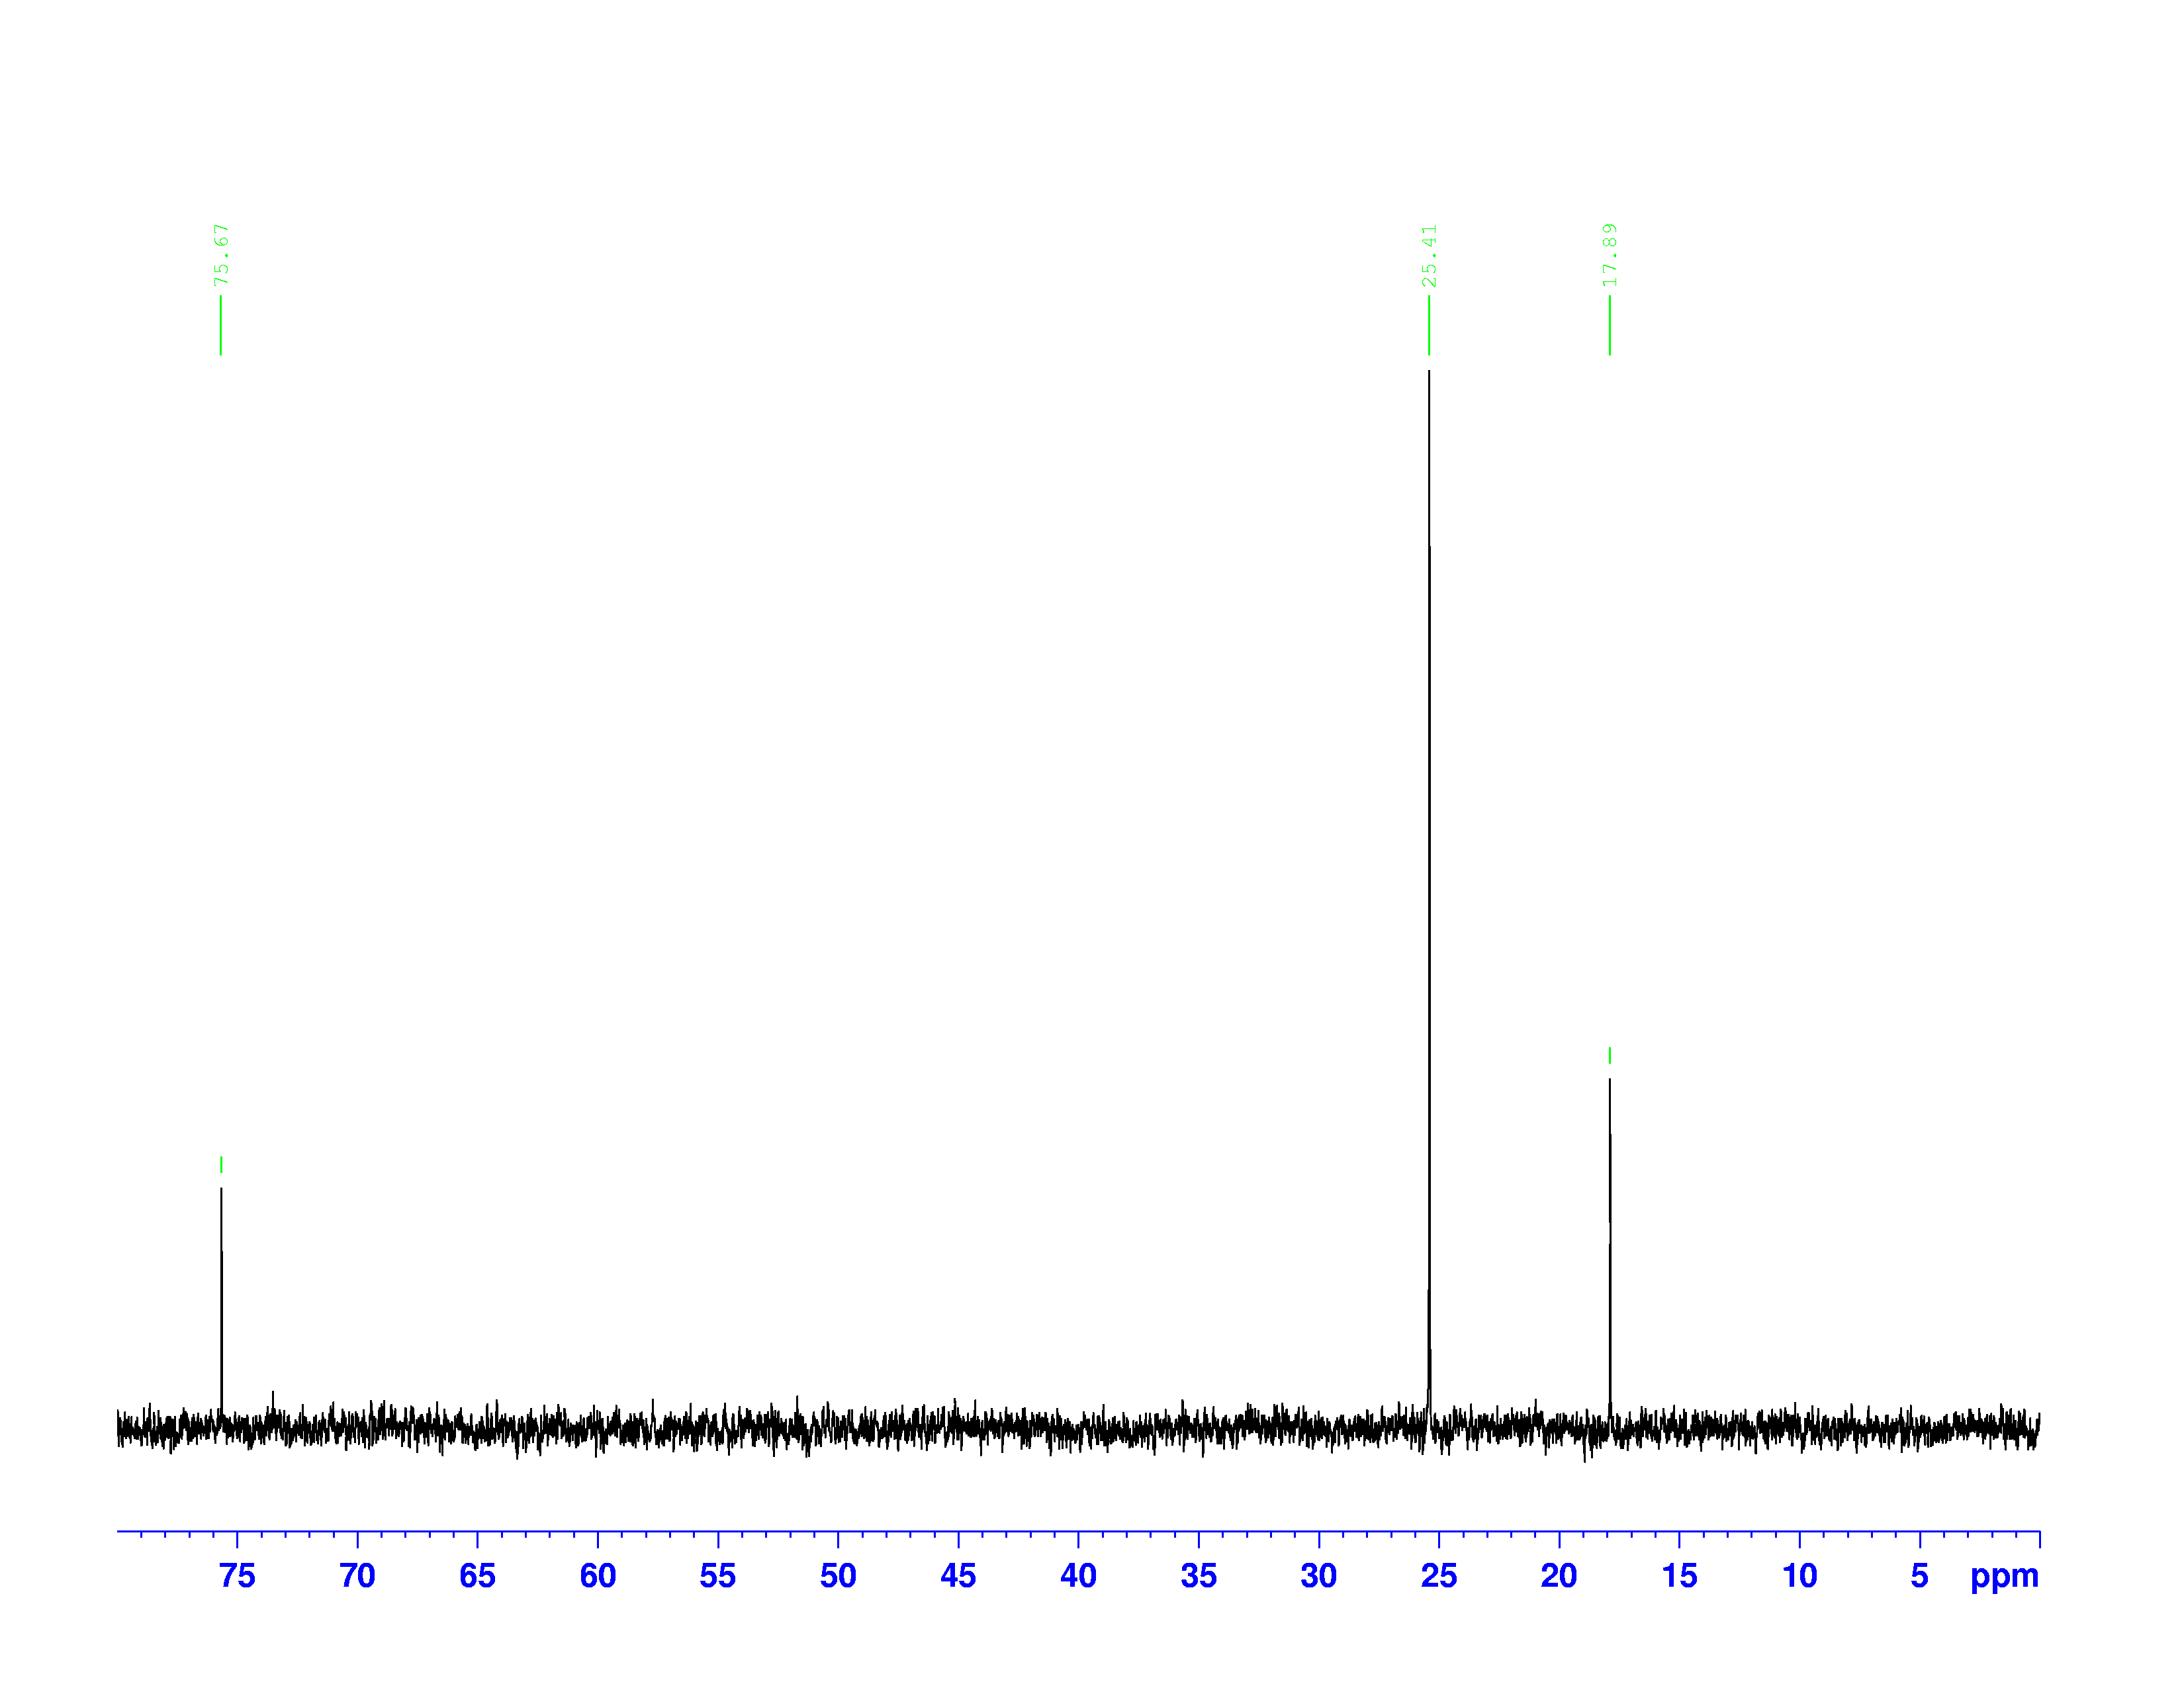
![]() C-NMR spectrum of 3,3-dimethyl-2-butanol
C-NMR spectrum of 3,3-dimethyl-2-butanol
Each peak in a ![]() C-NMR spectrum represents a specific “type” of carbon in the molecule. One peak can represent more than one carbon nucleus if they have the same electron densities.
C-NMR spectrum represents a specific “type” of carbon in the molecule. One peak can represent more than one carbon nucleus if they have the same electron densities.
The two spectra below are meant to be read together.
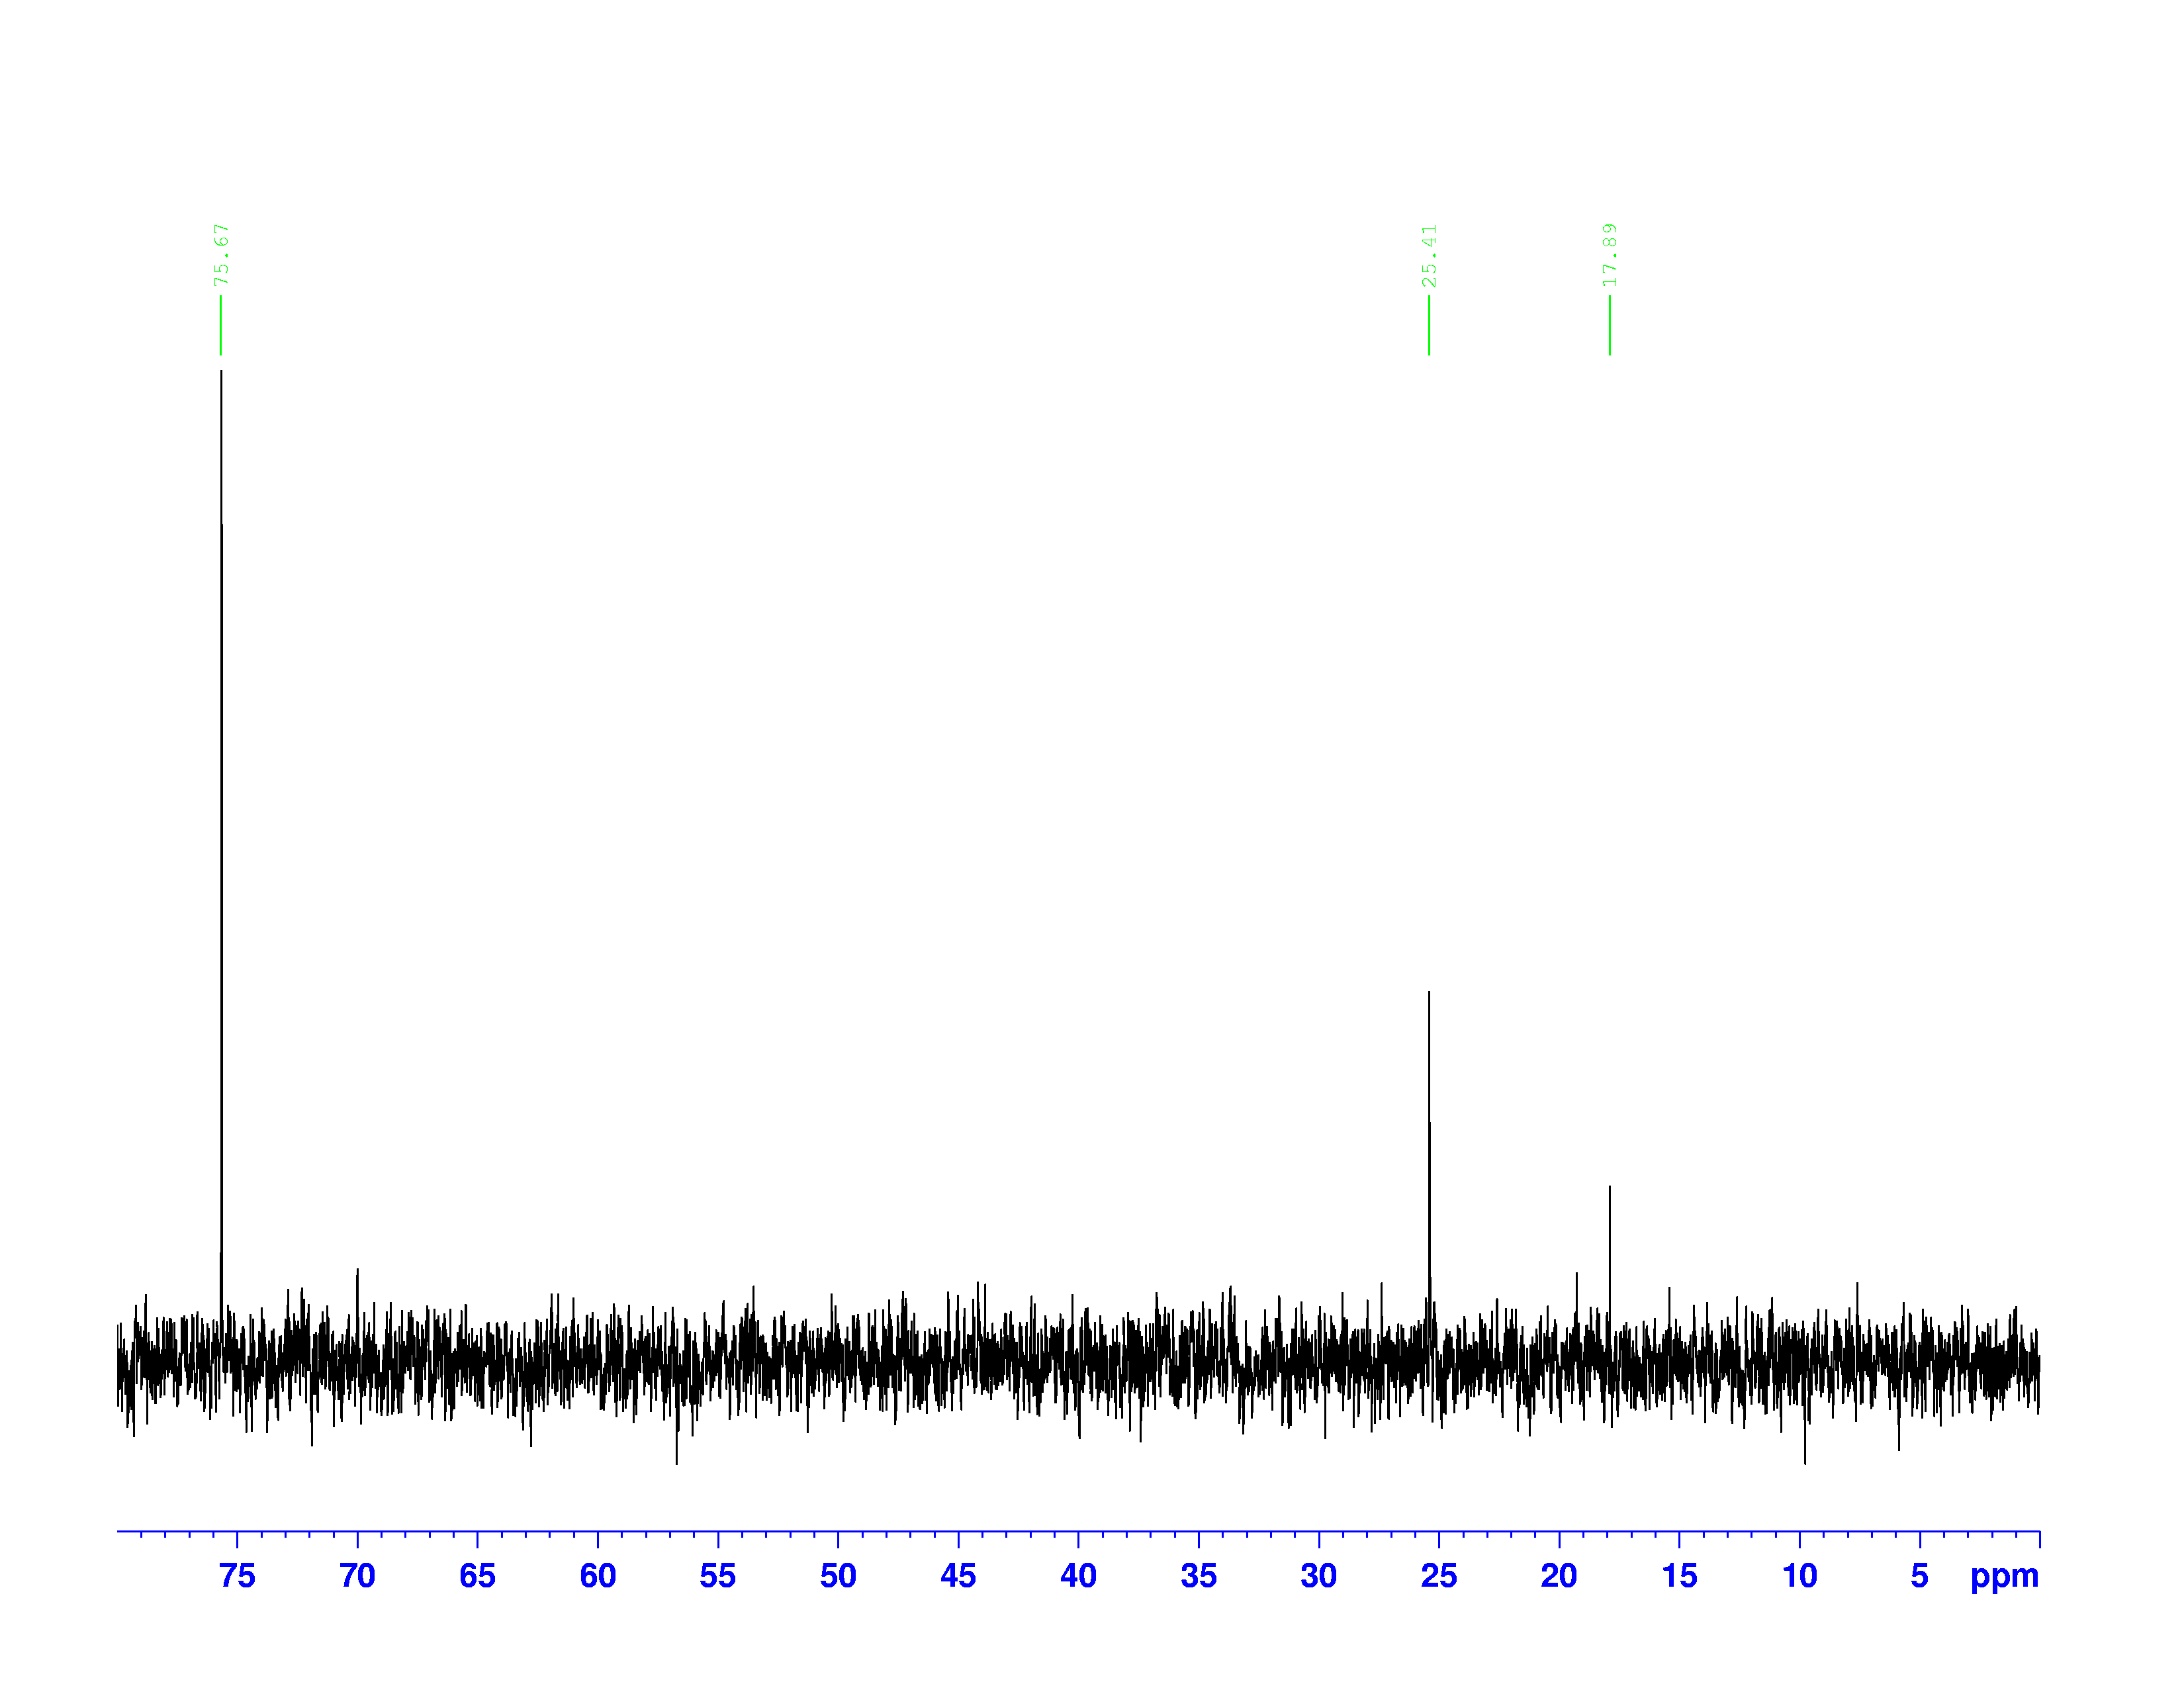 Top: DEPT-135 Spectrum; Bottom: DEPT-90 Spectrum
The peaks on these spectra describe the number of hydrogen atoms bound to each carbon atom. The frequencies of the peaks are the same as they are on the ![]() C-NMR.
C-NMR.
More information on exactly how to interpret each spectrum, and translate all of their information into a molecular structure, is forthcoming.



I love how you randomized the directions of the magnetic dipoles!