Map of the Week: Pictorial Map of the American Continent: Featuring the Pan American Highway and showing some of the natural resources, scenic wonders, and points of interest

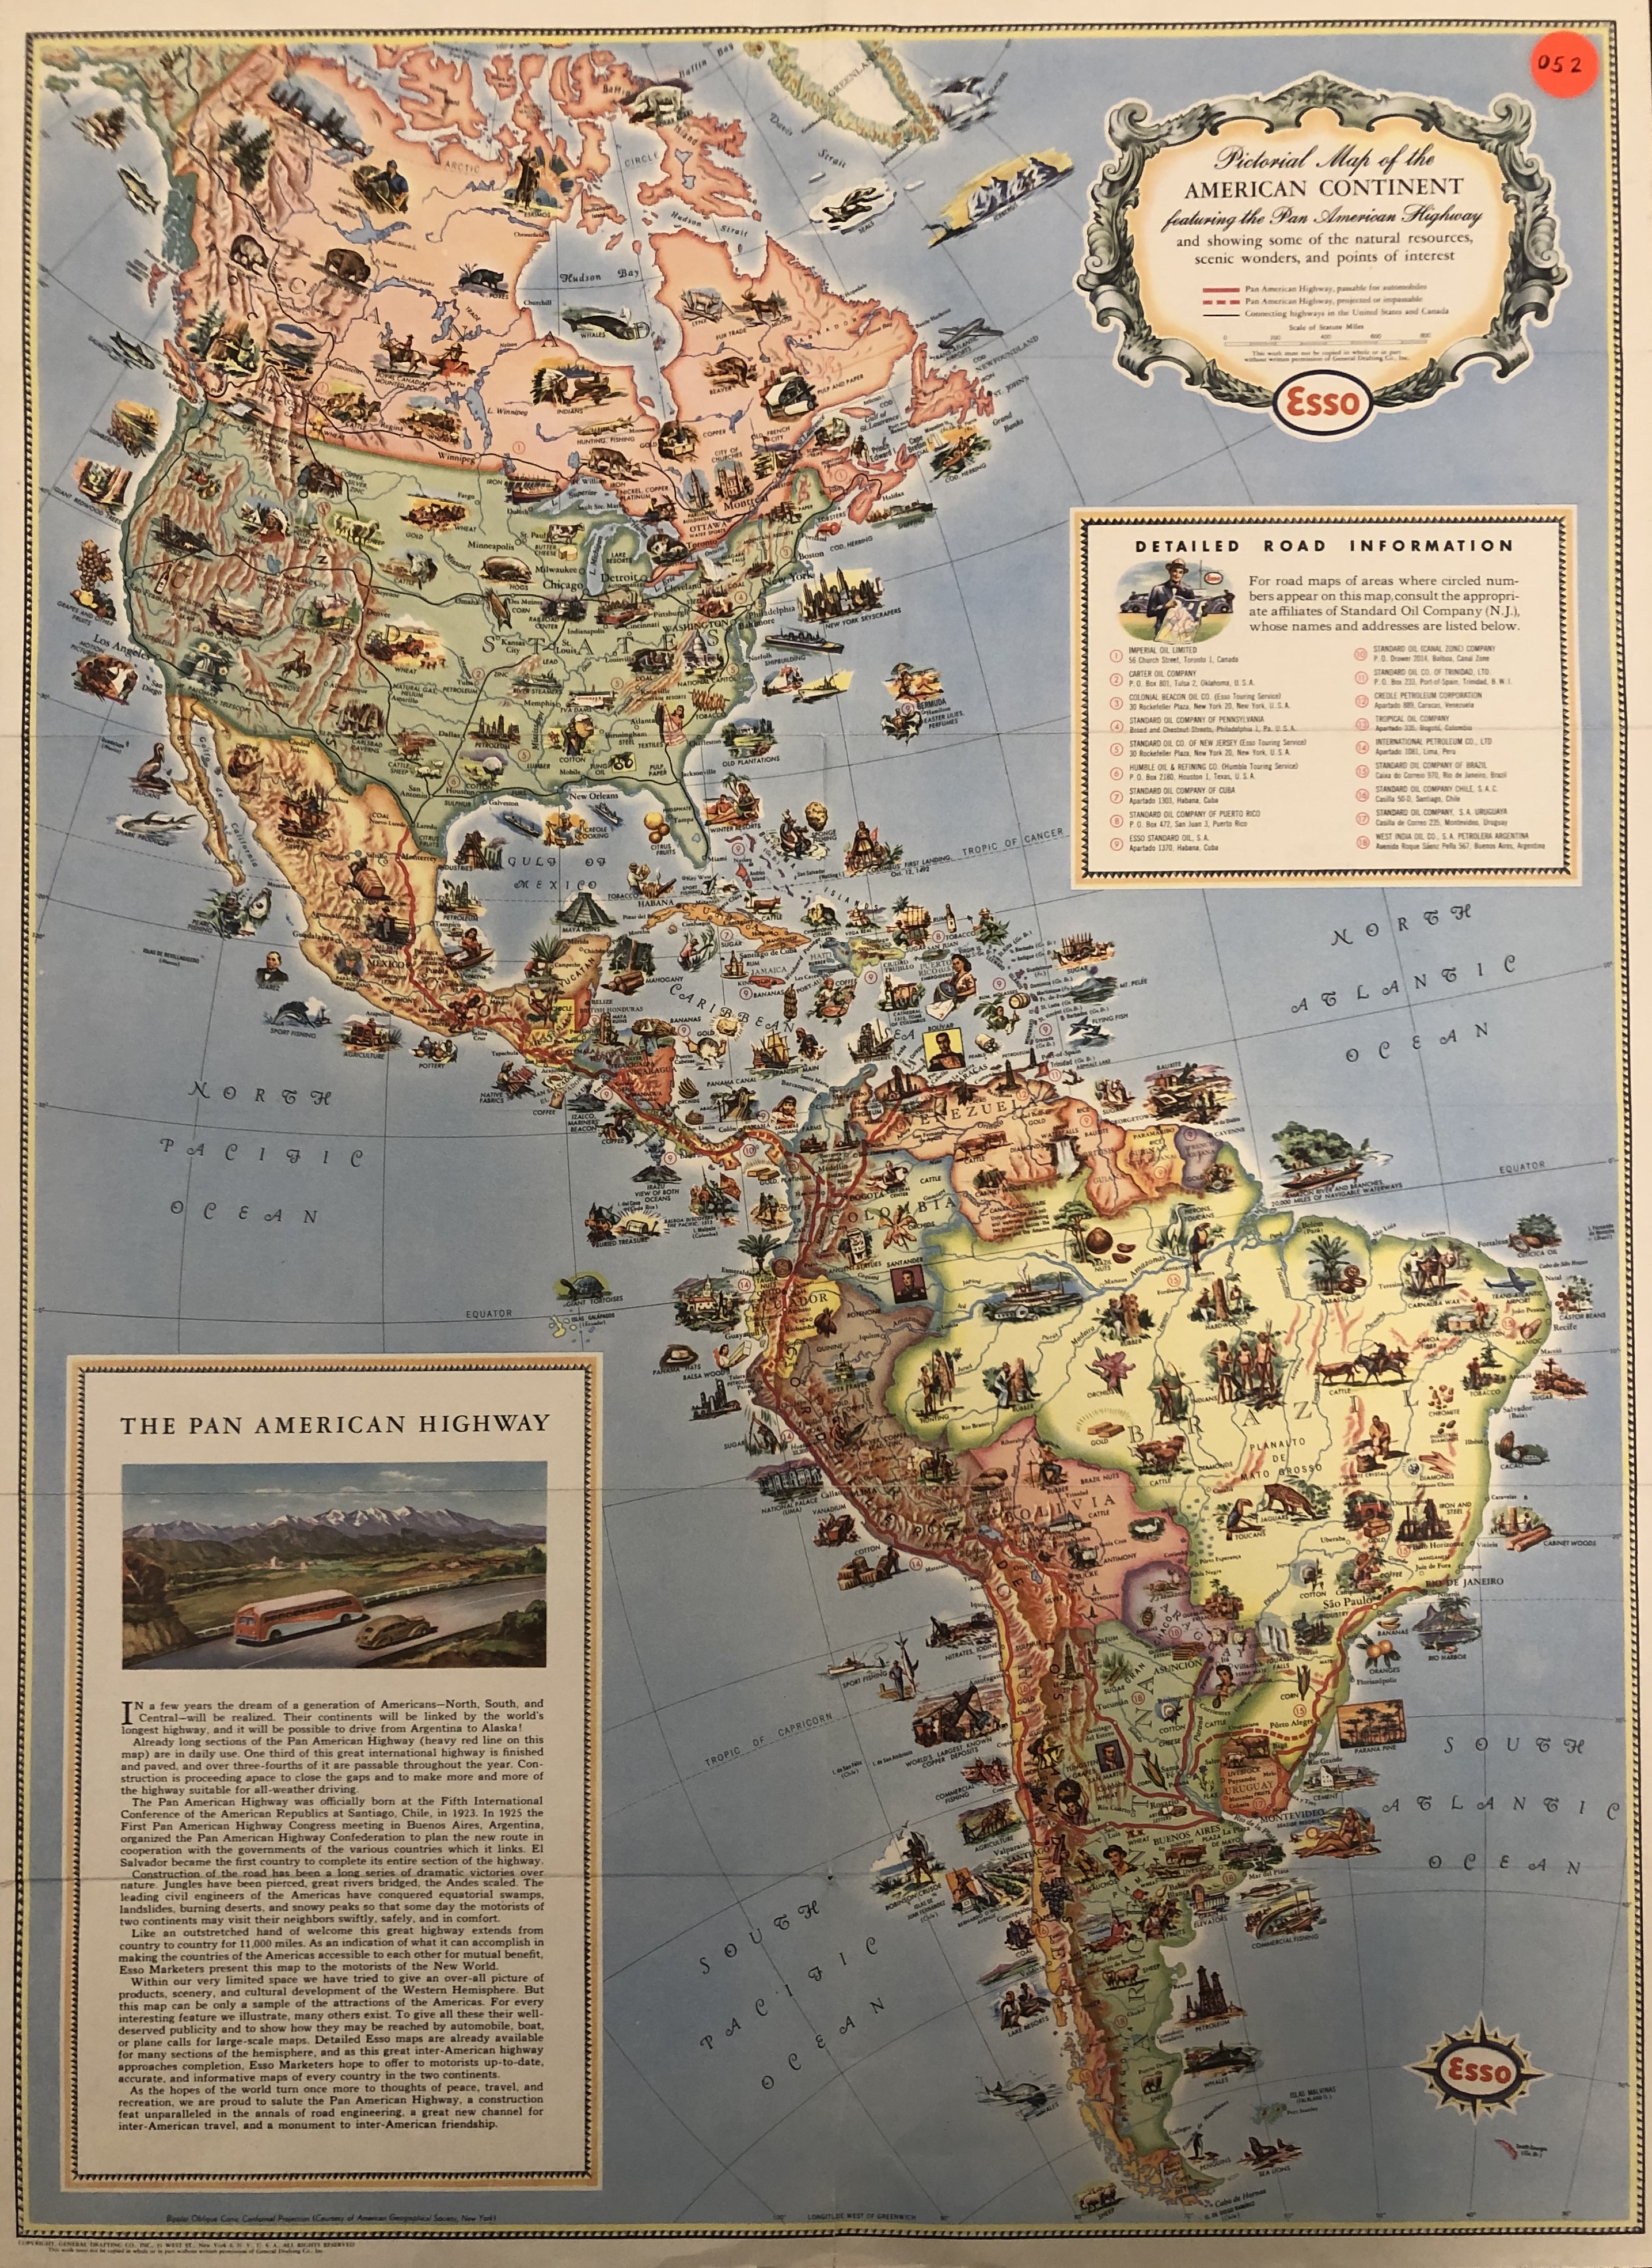
The back of this map is titled “Know Your Neighbors Better” and has descriptive articles on most of the countries featured on the map (including what were at the time French Colonies, British Honduras– later named Belize– British Guiana, and the British Island colonies, as so-called on the map).  Although there’s no written date, Guyana, which is referred to on the map as British Guiana, became formally independent from British rule in 1966, so we can assume this map was created before that (further research into the representations on the map might help us be able to pinpoint a more exact date). The convention on the Pan American Highway took place in 1937, so the map was created after that.

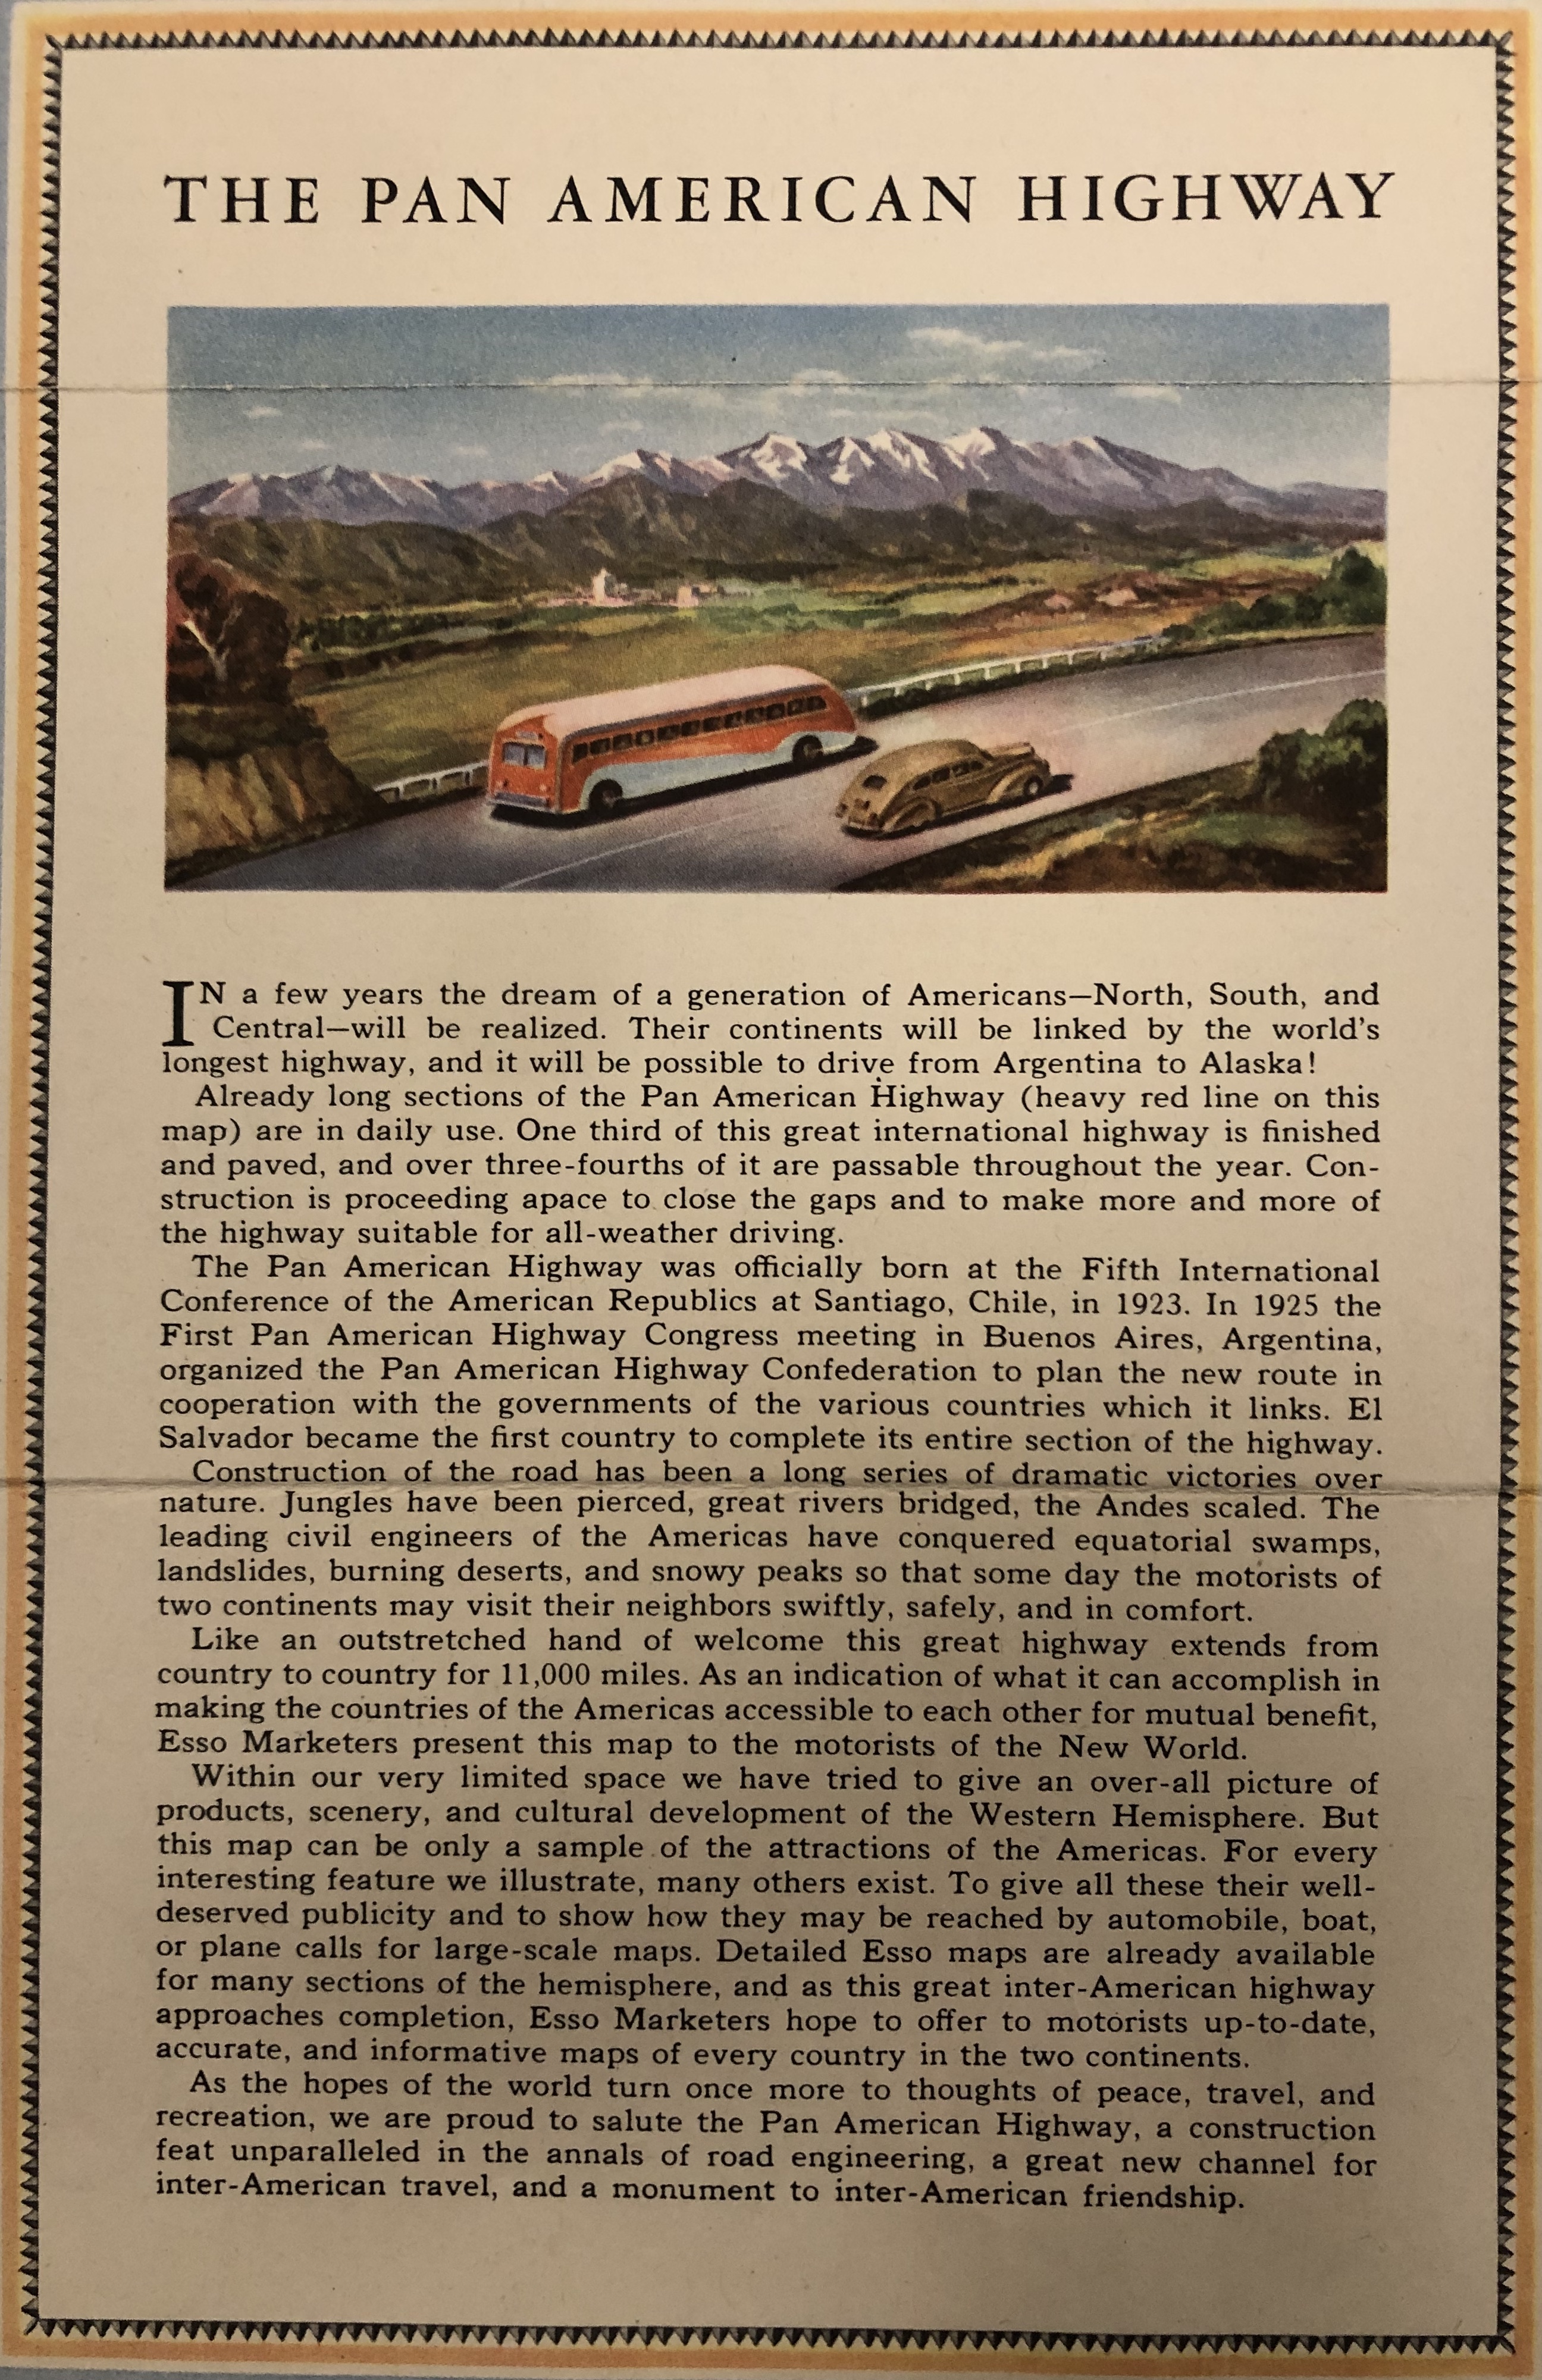
The sponsor of this map, Esso, is a trade name for the oil company ExxonMobil. Both the Pan American Highway itself, the frame of reference of the map, and the title– the American Continent– suggests a viewpoint of the Americas as essentially one place. The text box on the bottom right reads “As an indication of what it can accomplish in making the countries of the Americas accessible to each other for mutual benefit, Esso Marketers present this map to the motorists of the New World”. It’s important to note that, although Esso clearly portrays the highway as stretching across both continents, the United States and Canada have “connecting highways” that are not formally a part of the Pan-American Highway. What stake might Esso as an oil company have in promoting a Pan-American viewpoint that values interconnectedness and mutual accessibility? How might this interconnectedness in reality produce an imbalanced interdependence?

Finally, it’s important to think about the illustrations of industries and landmarks on the map, and the way it represents the resources of various areas. The text box reads, “construction of the road has been a long series of dramatic victories over nature”. How might the language of “conquering” nature be related to colonial histories, and how might a company like Esso continue to extract wealth from some places for the profit of others?

Have a good week,

Aidan Antonienko ‘21

Posted in Cool Stuff | Comments Off on Map of the Week: Pictorial Map of the American Continent: Featuring the Pan American Highway and showing some of the natural resources, scenic wonders, and points of interest

Map of the Week: Brasil: Proposed Manufacturing Industries

This map of Brazil from 1943 shows the locations of various natural resources and industries. It’s unclear from the “proposed” in the title who is proposing these industries and to what level they may be already existing. Note the lack of cartographic information, like projection, or exact markings of industry locations.

The producer of this map– R and A, OSS, in the bottom right corner– is the Research and Analysis branch of the Office of Strategic Services. According to the CIA website, this office was the agency’s forerunner. It was created in June 1942– less than a year after the U.S. formally entered World War II– by President Franklin Roosevelt. I couldn’t tell from preliminary research if the Board of Economic Warfare (under the title) was part of the OSS, but they at minimum worked together–geographers, historians, and political scientists worked in the U.S. bureaucracy to assess resources and infrastructure in certain areas or regions abroad (check out this declassified document referring to these practices in relation to Japan during the war).

How might the context of the world war have influenced what industries were chosen for this map, and what technologies might make these industries important? What is “economic warfare” in the context of World War II, who might it effect, and how might this phrase take on different meanings over time and in reference to different places?

Have a good week,

Aidan Antonienko ‘21

Posted in Cool Stuff | Comments Off on Map of the Week: Brasil: Proposed Manufacturing Industries

Map of the Week: Detroit Street Map

Michigan is a key swing state in this year’s presidential election. Although historically democratic, the state was narrowly won by Donald Trump in 2016. A recent New York Times article picked out three of the state’s counties– Macomb, Oakland, and Kent– as key areas in determining the state’s election results.

This 1966 Rand McNally/Gulf street map of Detroit includes portions of Oakland County, one of these key swing areas; in the northernmost portion of the map, you can see the Oakland-Wayne county line. Macomb county is to the east of Oakland County, also in the greater Detroit area (although not pictured on the map). Kent county is in the western portion of the state, in the Grand Rapids area.

Part of Michigan’s significance in these elections in particular is its identity as part of the so-called “rust belt” due to the rise and fall of the automobile industry in the state, especially in Detroit. Note the presence of car factories on this road map, the map’s sponsor Gulf, and the phrase at the top of the map, “petroleum promotes progress”. This phrase may not ring so true in Detroit today. How did these industrial comings and goings shape Detroit and Michigan in general, and how do these trends come to bear in electoral politics? How did the “progress” promoted by industry in the area relate to categories of race and class across space?

If you’re interested in election mapping, check out this brief slideshow explaining debates in election cartography from the New York Times.

Have a good week,

Aidan Antonienko ‘21

Posted in Cool Stuff | Comments Off on Map of the Week: Detroit Street Map

Map of the Week: Congressional Districts (100th Congress), 1987


Hi everyone,

Here’s another election-themed map as we get closer to November 3rd – hope you all have your absentee ballots in/have a voting plan if you’re able to vote. This map from the National Atlas of the United States shows congressional district boundaries and numbers (in red), along with county boundaries in orange. Note that several areas of the United States that aren’t pictured (and Washington, D.C., which is) have non-voting delegates.

According to the Brennan Center at NYU, state legislatures are currently responsible for drawing congressional districts in 30 states. New York is not one of these states, now using an advisory commission to draw districts (although these commissions may include state representatives and districts must be approved by the state legislature).

This is an important year for congressional districts, as they will be redrawn following the 2020 census. How does the pandemic affect the census this year, especially with some areas ending their count early? How might this affect future congressional maps?

This chart from the Encyclopedia Britannica shows the current number of representatives for each state– how have certain states’ representations changed? How has your congressional district changed?

Have a good week,

Aidan Antonienko ‘21


Brennan Center Congressional District Info: https://www.brennancenter.org/our-work/research-reports/who-draws-maps-legislative-and-congressional-redistricting


Posted in Cool Stuff | Comments Off on Map of the Week: Congressional Districts (100th Congress), 1987

Map of the Week: Known Sources of Primary Wealth, Commonwealth of Pennsylvania

Pennsylvania has gotten a lot of attention this election season, as a key swing state that President Trump won over Hillary Clinton in 2016– the first time a republican presidential candidate had won the state since 1988– and as a place that lies at the convergence of several key issues for this year’s candidates.

This map, published jointly by the Departments of Agriculture, Commerce, Internal Affairs, and Mines (presumably state departments and not national ones) in 1948, shows the sources of wealth, or what one could call primary capital-attracting industries, of the state. The cities are blacked out on the map to indicate their areas– highlighting their main function as separate from the other “products of mother earth” pictured on the map. As the map states, mines at the time made up “67 per cent of primary wealth, totaling $1,000,000,000 a year”.

Environmental policy, especially connected to fracking and the Green New Deal, has become a major talking point in the election as worries about jobs associated with fossil fuel industries are threatened by economic change, climate change, and a global pandemic. Joe Biden has highlighted his connections to Scranton’s working class, but in response to President Trump’s criticism has repeatedly assured that he will not ban fracking. Check out this interactive map of fracking in Pennsylvania by NPRhttp://stateimpact.npr.org/pennsylvania/drilling/, showing concentrations of fracking south of Pittsburgh and north of Scranton and including links to information on whether or not specific wells have been cited for violating environmental regulations.

How does the material world and evolving uses of technology change the importance of “primary sources of wealth” over time, and how might different forms of accumulation affect people and their politics? If we take the advice of the map and assume that “atmosphere and underground water supply are precious mineral resources” and that all wealth is dependent on human resources, what is necessary to recognize and care for them as such?

Have a good week,

Aidan Antonienko ‘21

Posted in Cool Stuff | Comments Off on Map of the Week: Known Sources of Primary Wealth, Commonwealth of Pennsylvania

Map of the Week: The Gold and Coal Fields of Alaska


The map from our archives hung up in the department each week will now also be posted here– this 1898 map from the U.S. Department of the Interior and USGS (potentially republished in National Geographic) shows gold and coal deposits in Alaska. Aside from the chosen geologic elements, note the steamer, postage, and trail routes, the international boundaries, the military reservation, and the densely labelled port cities.

A few key dates might help to put this map in context: according to the U.S. Department of State Office of the Historian, Russia first offered to sell Alaska to the US in 1859, but the sale did not go through until President Andrew Johnson signed the purchase treaty in 1867, after the Civil War had officially ended. You may remember learning about this purchase being called “Seward’s Folly”, as it was popularly seen as a miss-step until Alaska became a strategically important territory due to natural resources. The historian notes that the U.S. imposed a civil government in Alaska in 1884, supposedly to enforce U.S. mining laws. Alaska became a state in 1959.

In light of the geologic elements of the map, what depositional environments lead to the buildup of coal and gold, and what is their temporal relationship to each other? What made them important commodities at this time, as opposed to oil, which became a key commodity in the next century?

This map’s chosen combination of geologic and infrastructural features is telling; the attention to detail in listing port cities and transportation routes is reminiscent of other colonial maps concerned with extracting commodities. What is the relationship between these processes and human migration? How does this map erase indigenous life and history, and how can it be used to trace a history of dispossession?

by Aidan Antonienko ’21

Office of the Historian page for more contextual information: https://history.state.gov/milestones/1866-1898/alaska-purchase
Posted in Cool Stuff | Comments Off on Map of the Week: The Gold and Coal Fields of Alaska

Greetings to new GIS (and GIS-curious) students

Whether you’re on campus or off, attending class in-person or remotely, whether you’re learning geospatial mapping tools (Geographic Information Systems) in class or as part of a class, or in an internship or CEL placement, participating in Hudson Valley Mappers activities, or you’re just interested in learning more about the tools and how you can use them – greetings, and feel free to get in touch with me any time for help. 

I’d like to share with you this message from Joe Kerski, Education Manager at Esri, the developer of the software tools like ArcMap, ArcGIS Pro, ArcGIS Online, various mobile mapping tools, and ArcGIS Story Maps tools we rely on most heavily at Vassar. I second Joe in saluting your decision to learn GIS, and encourage you to listen to his take on current trends in GIS, why it matters, and skills for you to work on developing. Some of the latter may seem obvious and are probably helpful in almost any field, but Joe’s take on them is worth a listen (and endearingly dorky). 

  1. Be Curious
  2. Know how to work with and be critical of data
  3. Know geographic and technical foundations
  4. Be adaptable
  5. Develop good communication skills

Another seemingly obvious suggestion he makes earlier in the video is to start developing your professional network now. That’s easier to do than you might think, but not as many students have taken my advice to do this by joining professional GIS networks. Joe tells you to consider him as part of this network, and I can say from my own experience communicating with him that it’s not just talk. 

Again, feel free to get in touch with me any time for help. 

Posted in Cool Stuff | Comments Off on Greetings to new GIS (and GIS-curious) students

Coronavirus Cases at Public Colleges

A New York Times survey of public four-year colleges and private institutions that compete in Division I sports or is a member of an elite group of research universities, revealed at least 6,600 cases tied to about 270 colleges over the course of the pandemic. 

Confirmed coronavirus cases on college campuses, New York Times, July 29, 2020

Confirmed coronavirus cases on college campuses, New York Times, July 29, 2020

Colleges affected near Vassar include the U.S. Military Academy at West Point (89 cases), SUNY New Paltz (31 cases), and SUNY Purchase (12 cases).  For those of you attuned to the challenges of capturing accurate data, the NYT article discloses all of those it encountered in the article. The takeaway is that the numbers are almost certainly undercounted. It’s also important to note that most colleges surveyed have not yet begun their Fall semesters (though some are starting early), suggesting that many of the infections reported occurred before most campuses were shut down in March. 

Like many other colleges, Vassar is taking extraordinary steps to reduce the risk of infection as some students, staff, and faculty return to campus. However, as President Bradley and college administrators across the country acknowledge, there is a risk that each of us assumes by being on campus, and we have a responsibility to each other to abide by an agreed upon set of standards that have been established through consultation with medical and public health professionals. (See the Community Care Pledge – See Covid-19 Updates, 6/29/2020 – A Message From the President Regarding Plans for the Fall.)

Meanwhile, it is important to recognize that essential maintenance staff have remained working to maintain the campus throughout the pandemic; a debt of gratitude is owed to them as all essential workers and health care workers.

For more information about Vassar’s reopening plans and other updates regarding Coronavirus, visit https://www.vassar.edu/coronavirus-updates/

Posted in Coronavirus, Public Health | Comments Off on Coronavirus Cases at Public Colleges

Repost: On GIS, modesty & the problem of racial privilege

Diversity map image from Esri.com

Image: https://www.esri.com/about/newsroom/arcnews/racism-social-justice-and-gis/

Charles Convis of Esri’s Conservation Program and co-founder of the Society for Conservation GIS (SCGIS) posted a thoughtful and heartfelt post on GeoNet, Esri’s user community site, in light of the protests in the US and throughout the world calling all of us in positions of relative privilege to become aware of it, the advantages it conveys to us, and to adjust our thinking, behavior, cultural norms, and laws. He begins: 

Like many commentators & historians I’ve listened to, I agree that 2020 will be an historic year, probably the most impactful in my 66 year life. Many of the reasons are bad ones, though some of the most important reasons are good ones, such the widest national protests ever and the beginning of important yet difficult national conversations and institutional changes.

One of these conversations is about racial privilege, an assumed set of comfort and safety features for a dominant culture that they never talk about, but that are obvious and problematic for other cultures. 

Read the full post here. This will be the first in a series Charles will continue to work on and post up on GeoNet in the coming weeks called an “Inclusive History of Conservation GIS”. Continue reading

Posted in Social Justice and Inequality | Comments Off on Repost: On GIS, modesty & the problem of racial privilege

Spring 2019 Web Mapping Class Projects Focus on Local Challenges and Opportunities

Investigating the Impacts of Redlining in Poughkeepsie, N.Y. by James Gibson on behalf of Hudson River Housing.

Investigating the Impacts of Redlining in Poughkeepsie, N.Y. by James Gibson on behalf of Hudson River Housing.

GEOG 228 (Web Mapping: Advanced Approaches to Publishing) is a half-unit course offered during the Spring semester, which introduces students to creating web maps, map apps, story maps, and other emerging applications on the ArcGIS Online. These applications offer new opportunities to publicize and share spatial data. Building on skills learned in GEOG 220 (Cartography) and GEOG 224 (GIS), students in GEOG 228 gain further experience with GIS, learn effective ways of communicating spatial data to an online audience, and have the opportunity to explore special topics. 

Coordinating with the Office of Community Engaged Learning, students worked with Professor Mary Ann Cunningham and the following community partners to devise a question, locate data, and created an app or story map in ArcGIS Online.

Tree City? Why not Bee City? Storymap created by Thomas Schindelman for the Environmental Co-op at Vassar Barns.

Tree City? Why not Bee City? Storymap created by Thomas Schindelman for the Environmental Co-op at Vassar Barns.

All student projects can be viewed on the course project site

Posted in Cool Stuff | Comments Off on Spring 2019 Web Mapping Class Projects Focus on Local Challenges and Opportunities