

Hi everyone,
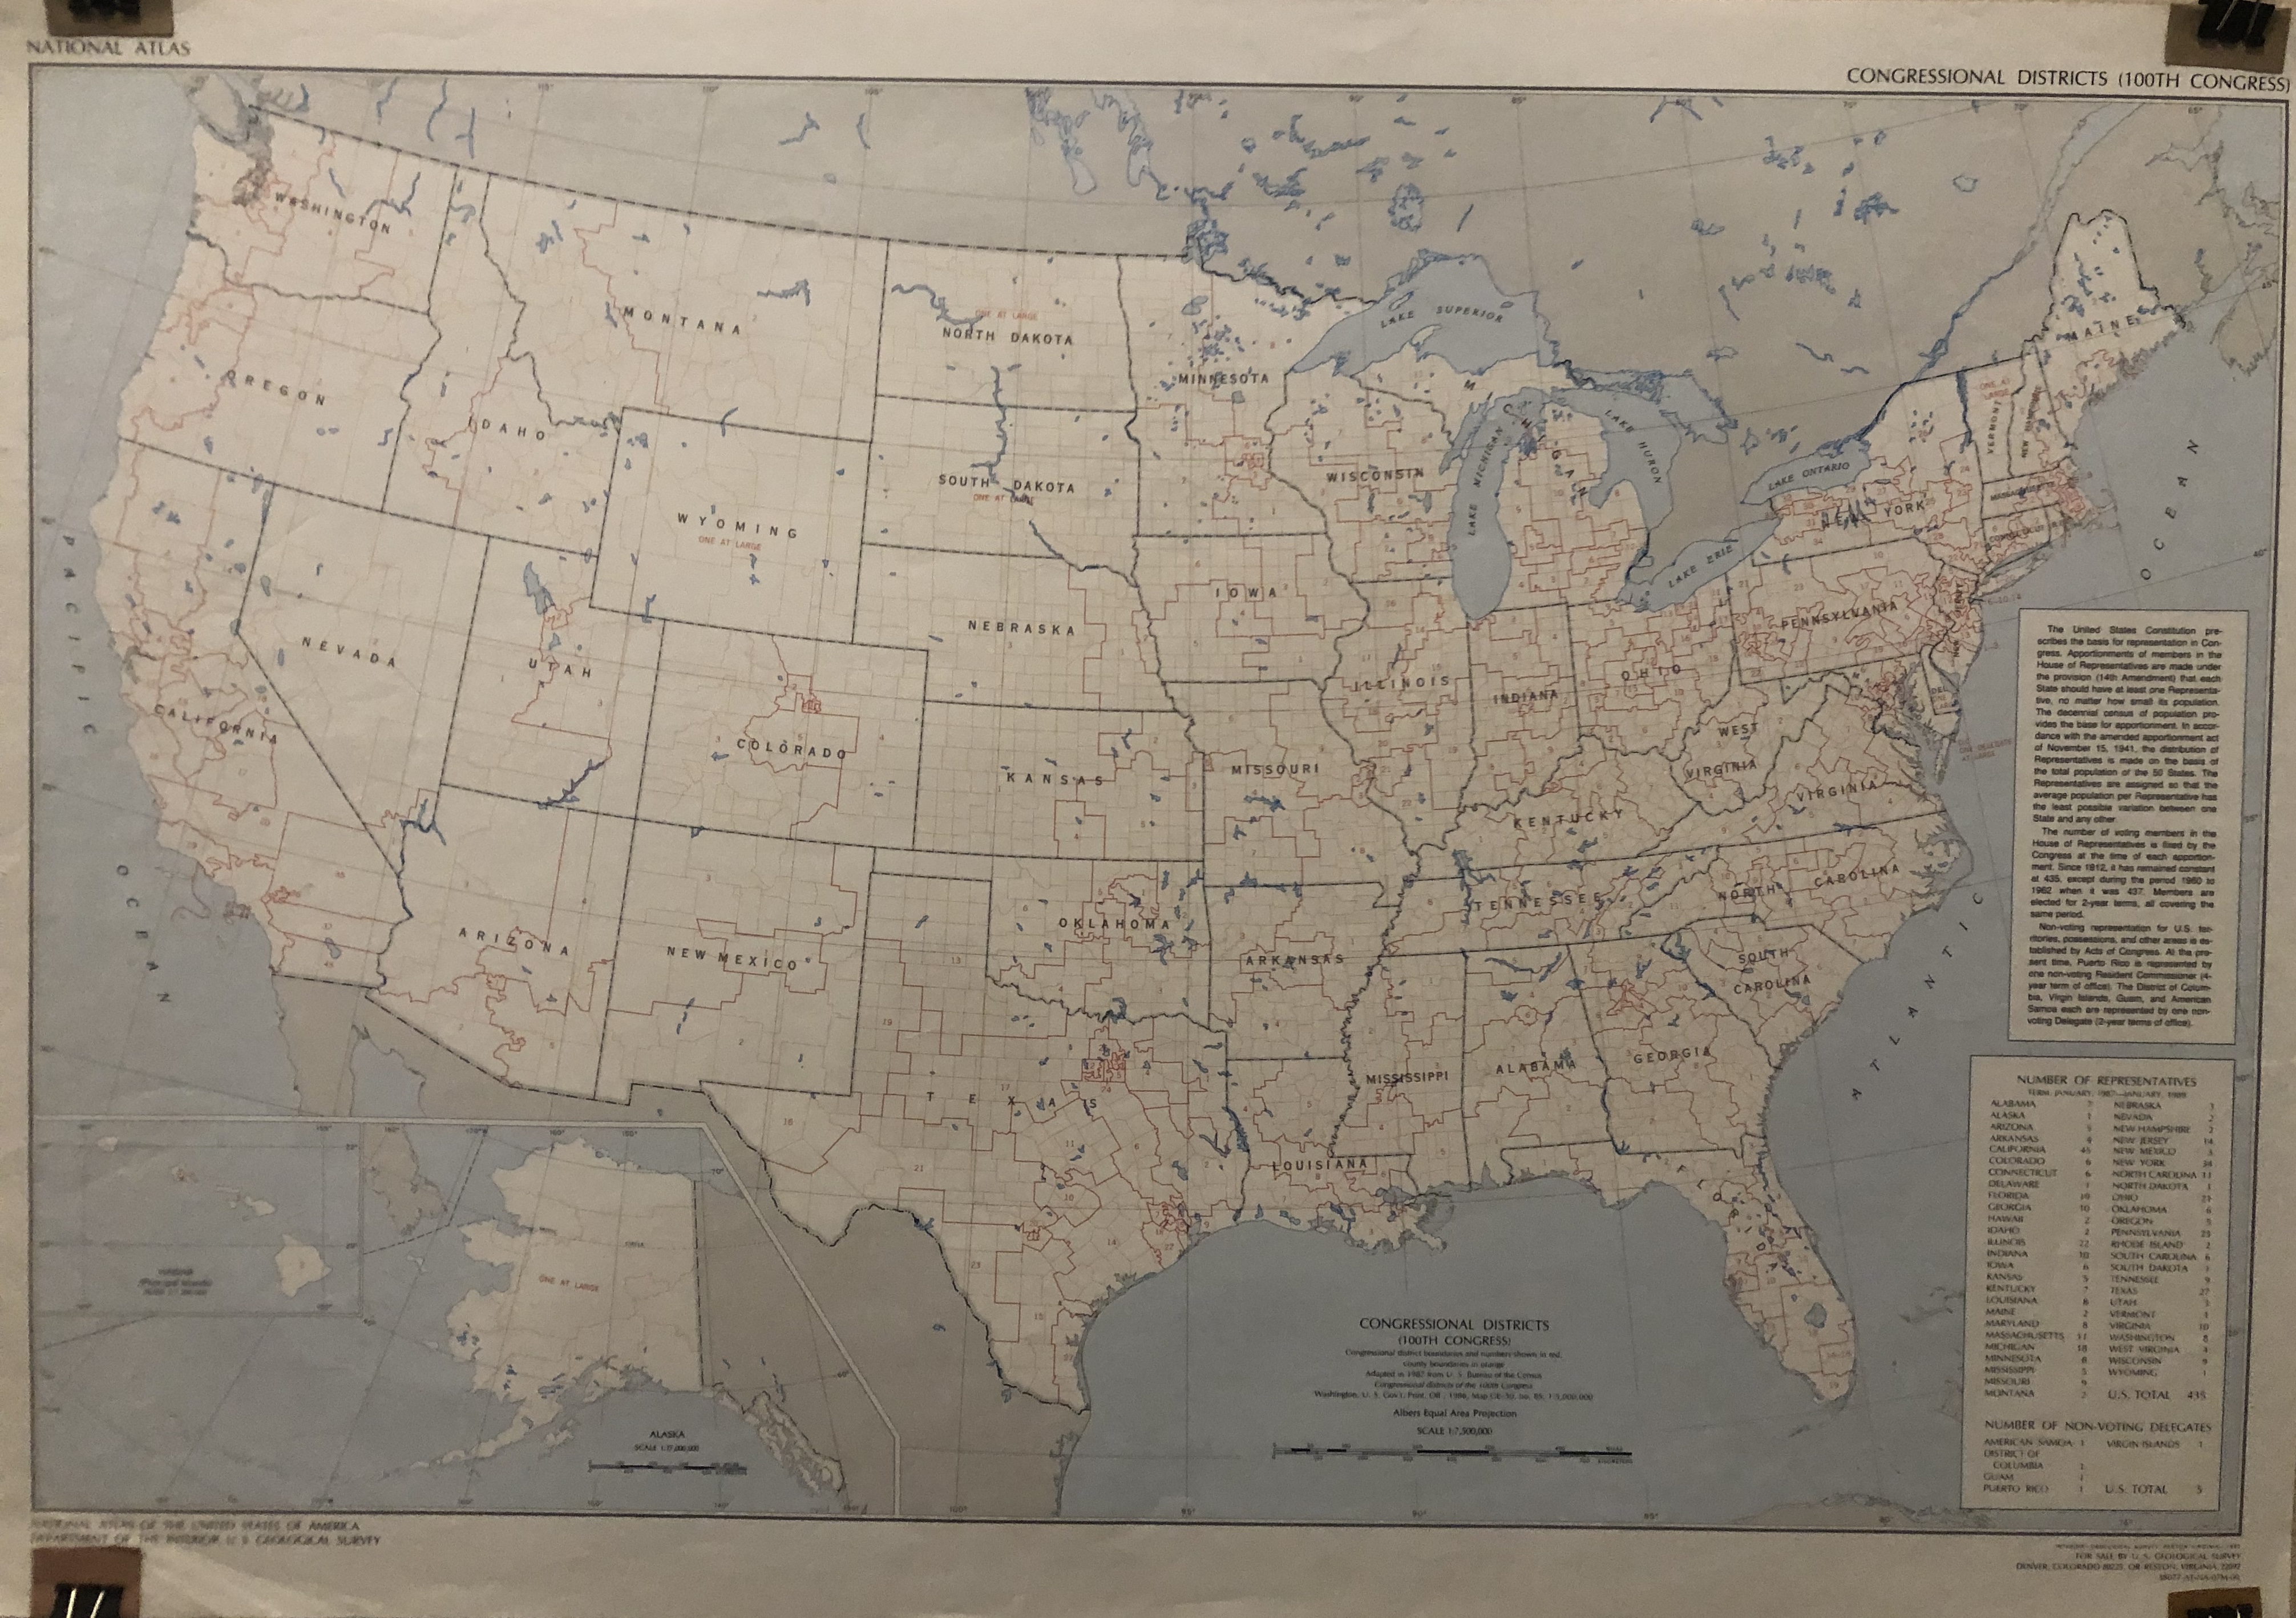
Here’s another election-themed map as we get closer to November 3rd – hope you all have your absentee ballots in/have a voting plan if you’re able to vote. This map from the National Atlas of the United States shows congressional district boundaries and numbers (in red), along with county boundaries in orange. Note that several areas of the United States that aren’t pictured (and Washington, D.C., which is) have non-voting delegates.
According to the Brennan Center at NYU, state legislatures are currently responsible for drawing congressional districts in 30 states. New York is not one of these states, now using an advisory commission to draw districts (although these commissions may include state representatives and districts must be approved by the state legislature).
This is an important year for congressional districts, as they will be redrawn following the 2020 census. How does the pandemic affect the census this year, especially with some areas ending their count early? How might this affect future congressional maps?
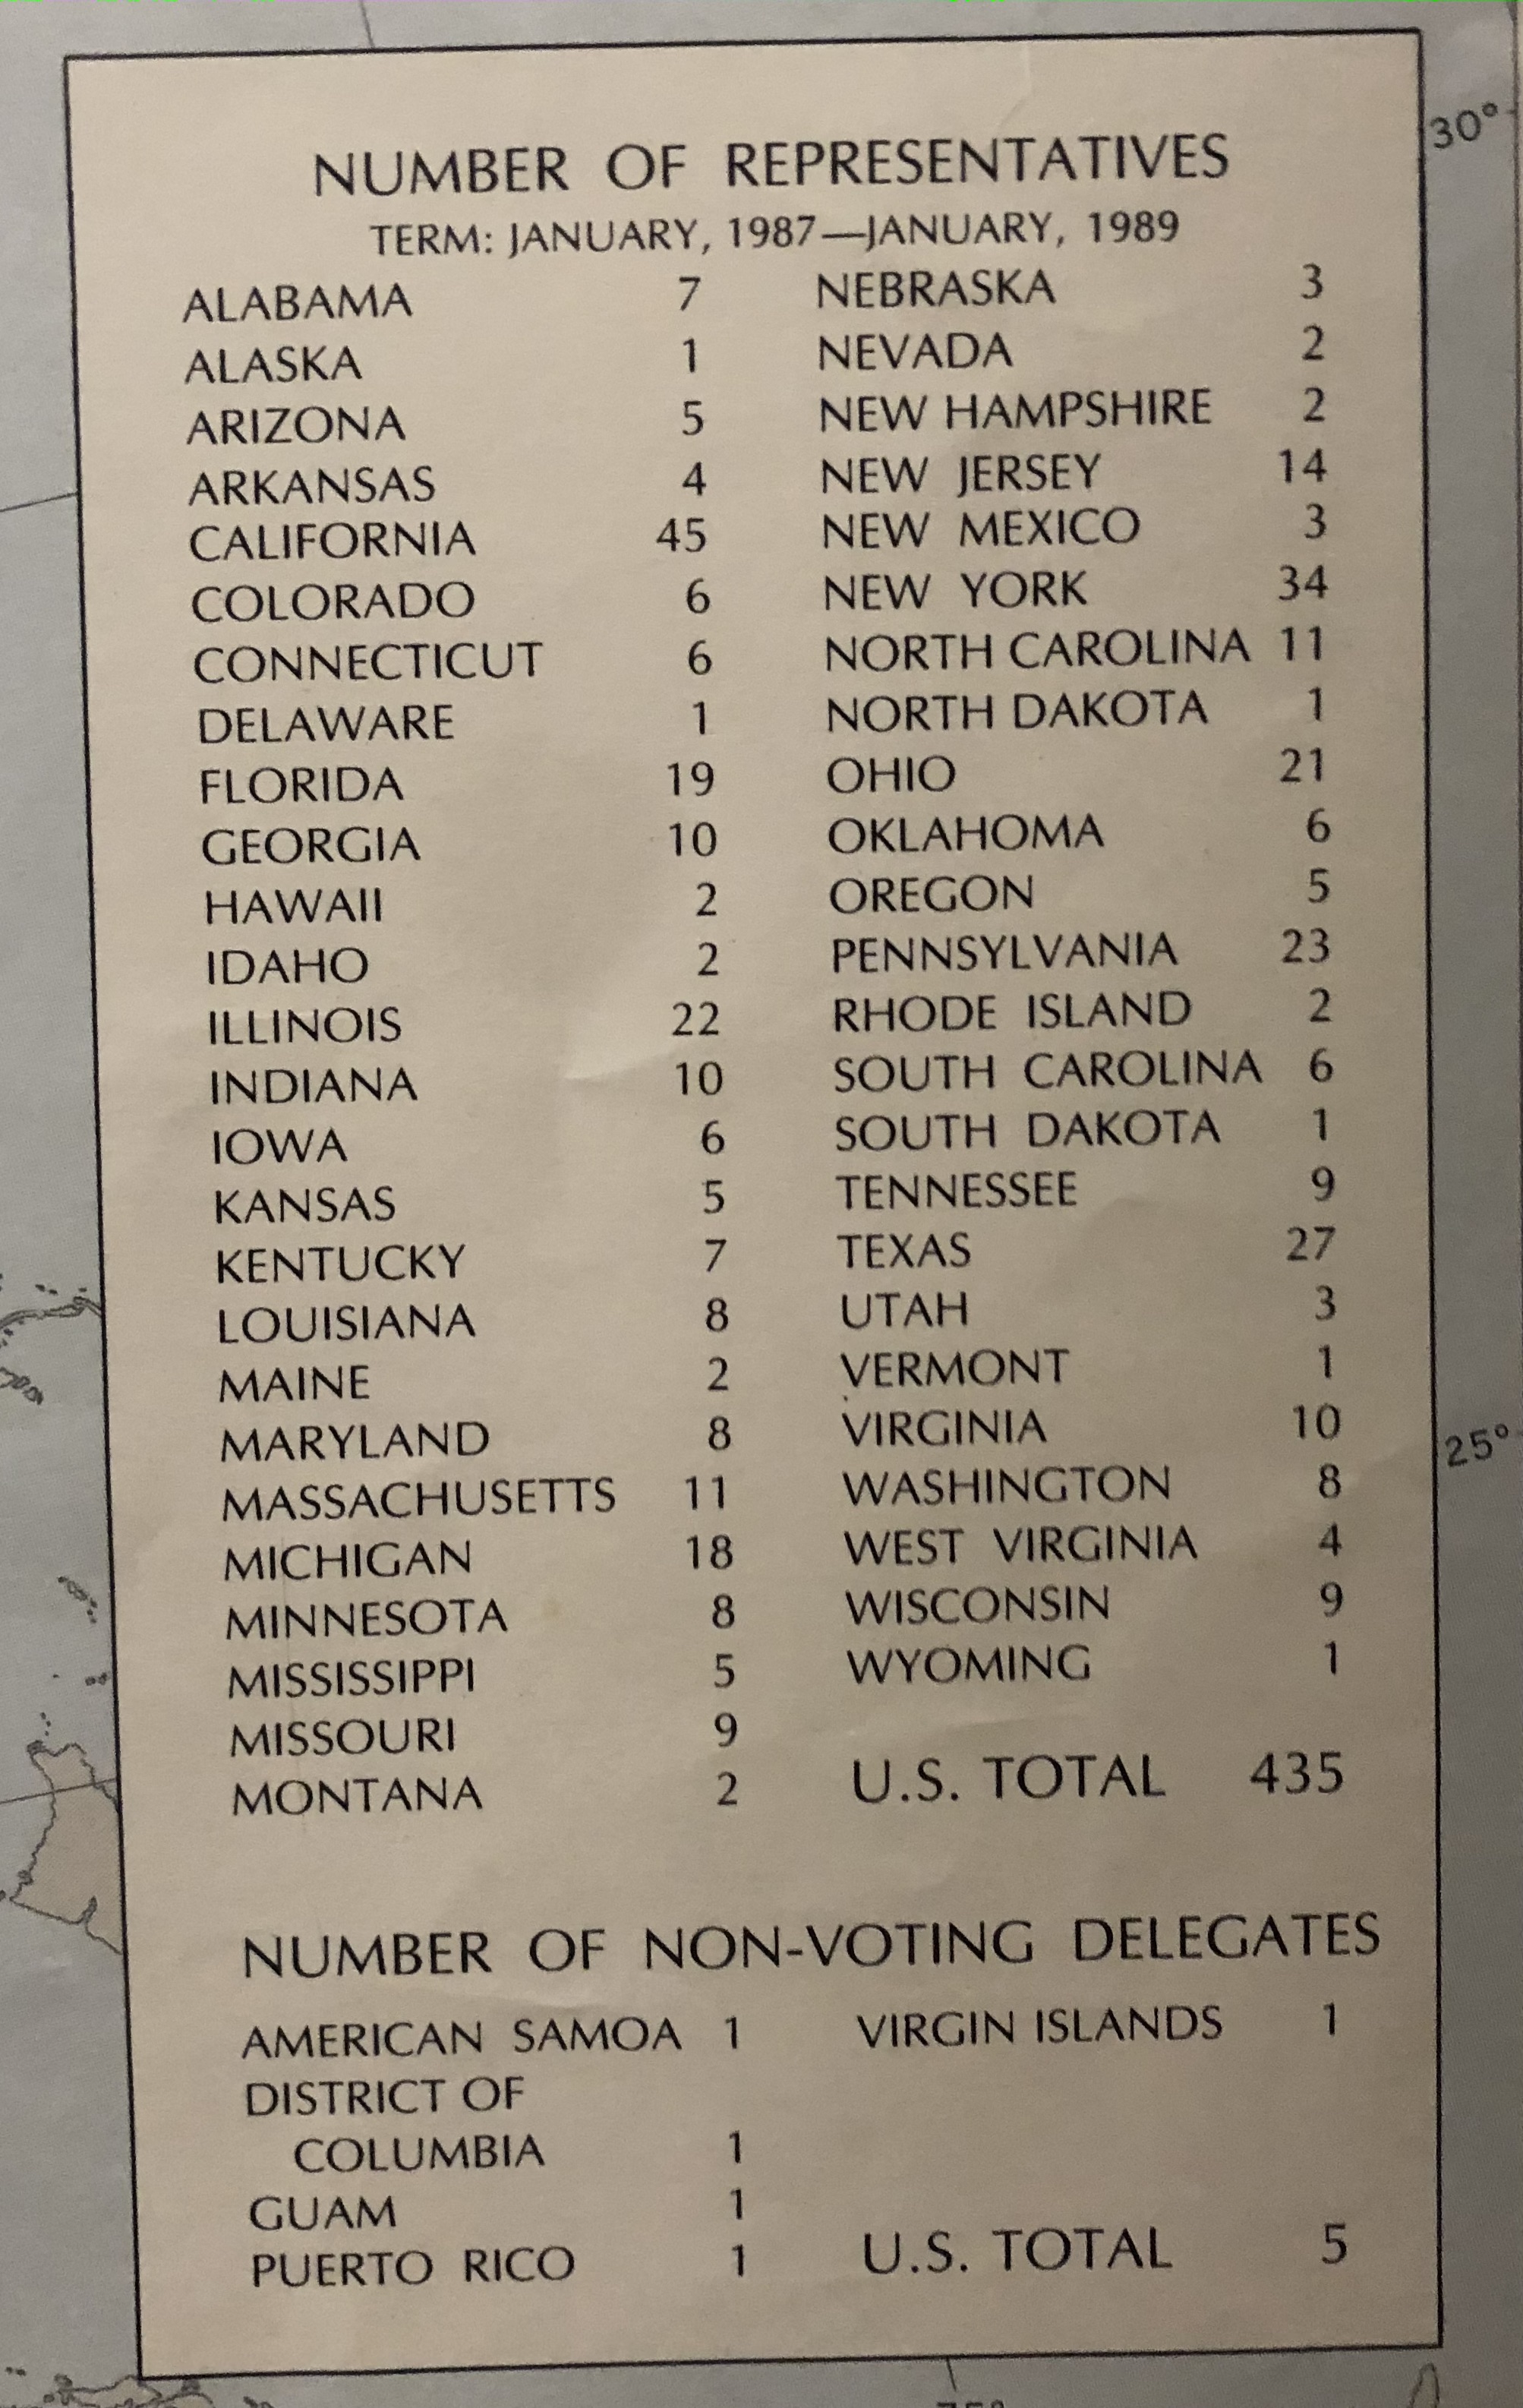
This chart from the Encyclopedia Britannica shows the current number of representatives for each state– how have certain states’ representations changed? How has your congressional district changed?
Have a good week,
Aidan Antonienko ‘21
Brennan Center Congressional District Info: https://www.brennancenter.org/our-work/research-reports/who-draws-maps-legislative-and-congressional-redistricting