Overview
For my final project I solved Kepler’s Equation numerically using Newton’s Method. Because it is a transcendental equation and thus cannot be used to solve for the eccentric anomaly directly, I created a program that uses iterative methods to solve it and then plots the solutions. Beyond this, I focused in particular on making the program user friendly to make it more usable as a teaching tool. For instance, I included detailed explanations of Kepler’s Equation as well as the ability for the user to change parameters. The reason I chose this project was because I wanted to deepen my own understanding of Kepler’s Equation and creating a program that teaches people about the equation helped me do that.
Program
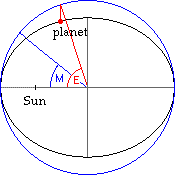
Kepler’s Equation is as follows: M = E – e*sin(E) where M is mean anomaly, E is eccentric anomaly and e is eccentricity. The program focuses on explaining these three quantities and the roles they have in calculating orbits. The following picture (from www.jgiesen.de) depicts mean and eccentric anomaly:
In the picture, the black ellipse is the actual orbit being calculated (slightly eccentric) and the blue circle is the orbit without any eccentricity. The mean anomaly is the angle from the main body (in the solar system: the sun) to where a planet would be if its orbit were perfectly circular.The eccentric anomaly is the angle from the main body to a point above the actual orbit on a tangent circle.
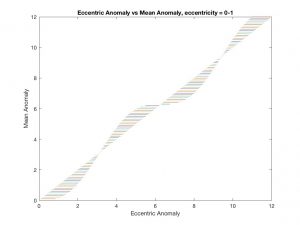
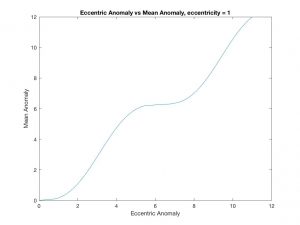
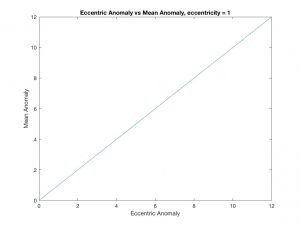
The first graph that the program produces is a plot of eccentric anomaly versus mean anomaly at all values of eccentricity (0 to 1) in steps of 0.1. The shaded region represents possible values for E at fixed M or vice versa. As eccentricity is increased from 0 to 1, M and E get further apart. Next, we look at the extremes: e = 0 and e = 1:
As you can see, when e = 1, M and E are very different at most points. However, at e = 0, M and E are the same and the plot is a straight line. This makes sense looking back at the definition of M and E; an e value of 1 means that the orbit is a perfect circle and therefore the mean and eccentric anomaly are equal.
The program also allows for some interactivity so it can be used as a teaching tool; above is how the program explains the graphs of mean anomaly versus eccentric anomaly. After the explanation, it waits for user input and then graphs mean anomaly versus eccentric anomaly with the user-specified eccentricity.
Conclusion
Overall, I’m happy with the outcome of this program. I think that Newton’s Method worked well to solve Kepler’s Equation and it was fairly straightforward to implement in Matlab. I also liked how the educational part of the program came out. However, if I were to redo this program I would possibly use a different programming language because I was unable to find any way to make the interactive part of the program user friendly. For example, I would’ve liked the text explanations to display somewhere besides the command window and would’ve added a button to advance in the program rather than through typed numbers.
References
http://www.jgiesen.de/kepler/img/keplerEllipse.gif
https://www.csun.edu/~hcmth017/master/node16.html
http://mathworld.wolfram.com/KeplersEquation.html


