Motivations
Protoplanetary disks are regions of planet formation around young stellar objects. Astronomers observe these regions to get snapshots of the planet formation process. Protoplanetary disks are optically thick at visible wavelengths, meaning that photons in the visible part of the electromagnetic spectrum from the star are absorbed by the disk and do not reach observers on Earth. Millimeter wavelength light is not absorbed by the disk as much, and so by observing light in that range, astronomers can learn about the morphology of disks. One key molecule abundant in protoplanetary disks is carbon monoxide (CO). Because of the low temperatures of disks (around 40 K), the energy transitions observed fall in the rotational and vibrational (rovibrational) regime.
Overview
When two atoms form a stable covalent bond, they can be thought of semi-classically as a two atoms connected by a spring. That spring can vibrate, and the energies of the vibrations can be found by treating the bond as a harmonic oscillator. This gives us
where v is the vibrational quantum number associated with different vibrational energy levels.
Diatomic molecules can also rotate in different ways, corresponding to different rotational energy levels. Assume that the molecules act as rigid rotors, meaning you assume that the molecules are connected by a solid rod as they rotate so that the bond length does not change. This lets you solve the Schrödinger equation and get the allowed energies.The energy associated with a rotational state is given as
where j is the rotational quantum number and I is the moment of inertia of the molecule. Molecular spectroscopists define the rotational constant B
which has which as units of energy. B changes based on the molecule, and for CO I found the value of B to be as listed above.
My goal with this project was to explore the fundamental rovibrational spectrum of CO. I first investigated energy in a rovibrational system and plotted how it changes for different rotational states. I did this using Python 3 and the libraries NumPy and Matplotlib. Then I modeled the intensity of different lines in the fundamental spectrum of CO and overlaid it with experimental data taken from the high-resolution molecular absorption database (HITRAN).
Selection Rules
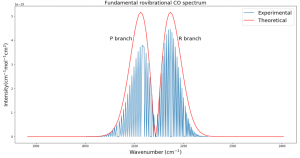
Selection rules describe what quantum state transitions are allowed in a given system. The fundamental spectrum in this context refers to the transition in which the vibrational state (v) changes by +- 1. This gives rise to the selection rules. If the vibrational state changes by +- 1, the rotational state must also change by +- 1, no more and no less. In this field, the [forbidden] transition of Δv = +- 1 and Δj = 0 is called the “Q branch”, and it appears in Fig. 3 as an empty spot in the middle. When the rotational state changes by +1, the transition is said to be in the “R branch”, and when it changes by -1 the transition is in the “P branch”. These selection rules can be summarized as:
- Both the vibrational and rotational quantum numbers must change
- Energy of rotation can be added to (in the R branch) or subtracted from (in the P branch)
The energy of transitions in the R and P branches respectively are:
where the first term corresponds to initial energy of the system before the transition.
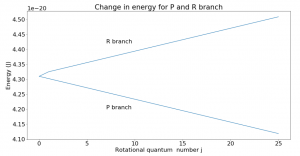
Though the energy of rotational states increases with increasing j, the difference between two consecutive levels is always 2B, where B is the rotational constant. This can be seen in Fig. 2. If going to a higher rotational state (in the R branch), add 2B to get the new energy level; subtract 2B for a lower state.
Results
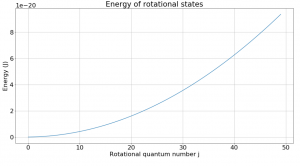
Fig. 1 shows how rotational states increase in energy based on the equation listed above. Despite the slope of this graph not being constant, a look at the change in energy between levels reveals an interesting fact about rotational transitions.
Fig. 2 plots change in energy vs. rotational quantum number for the R and P branches. The Q branch is the corner point where no transitions occur. From the graph, we can see that if undergoing a transition on the R branch, the energy of the state will increase linearly from one state to the next. That change is given by the slope of the graph which was found to be 2B, as expected. Similarly, the P branch energy transitions decrease by 2B from one transition to the next. Note that the rotational quantum number j can only increase or decrease by 1 with each transition.
Fig. 3 plots the theoretical relative intensities of different transitions based on the following equation:
where k is the Boltzmann constant and the temperature T was set to 300 K. The blue spectral lines come from experimental data from HITRAN. The x axis is given in wavenumbers, a unit commonly used in molecular spectroscopy.
Discussion
Fig. 3 was the most challenging result for me to produce and took several weeks of trying many different methods. Plotting the actual data was somewhat simple with Python, but calculating the relative intensities took me down many dead ends before finally getting the end result. Different sources listed different equations for intensity and different values of B. Eventually after calculating my own B and using an equation from Bernath, I was able to get the desired result.
I expected that the theoretical and experimental distributions would not match exactly, and that is because real molecules do not act exactly like rigid rotors. They experience centrifugal distortion and rovibrational coupling, which both add complications to the simplistic energy equations I used. However, my goal was to calculate the simplistic version of the fundamental rovibrational spectrum, and I accomplished that. In future work I would like to try to add complications to the model to better fit real data. I would also like to see how the environment of a protoplanetary disk could affect the spectrum.
References
Spectrum of Atoms and Molecules by Peter F. Bernath
Fundamentals of Molecular Spectroscopy by C. N. Banwell


