Category Archives: Uncategorized

Humanitarian Intervention During the Clinton Presidency

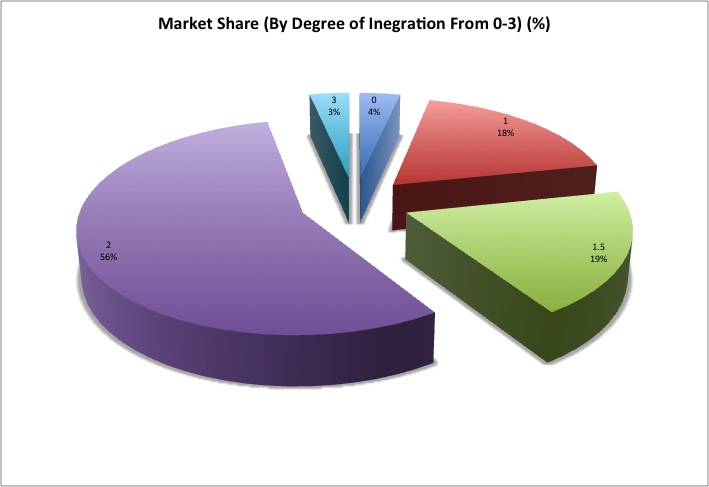
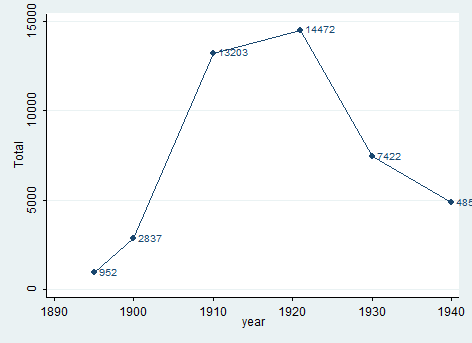
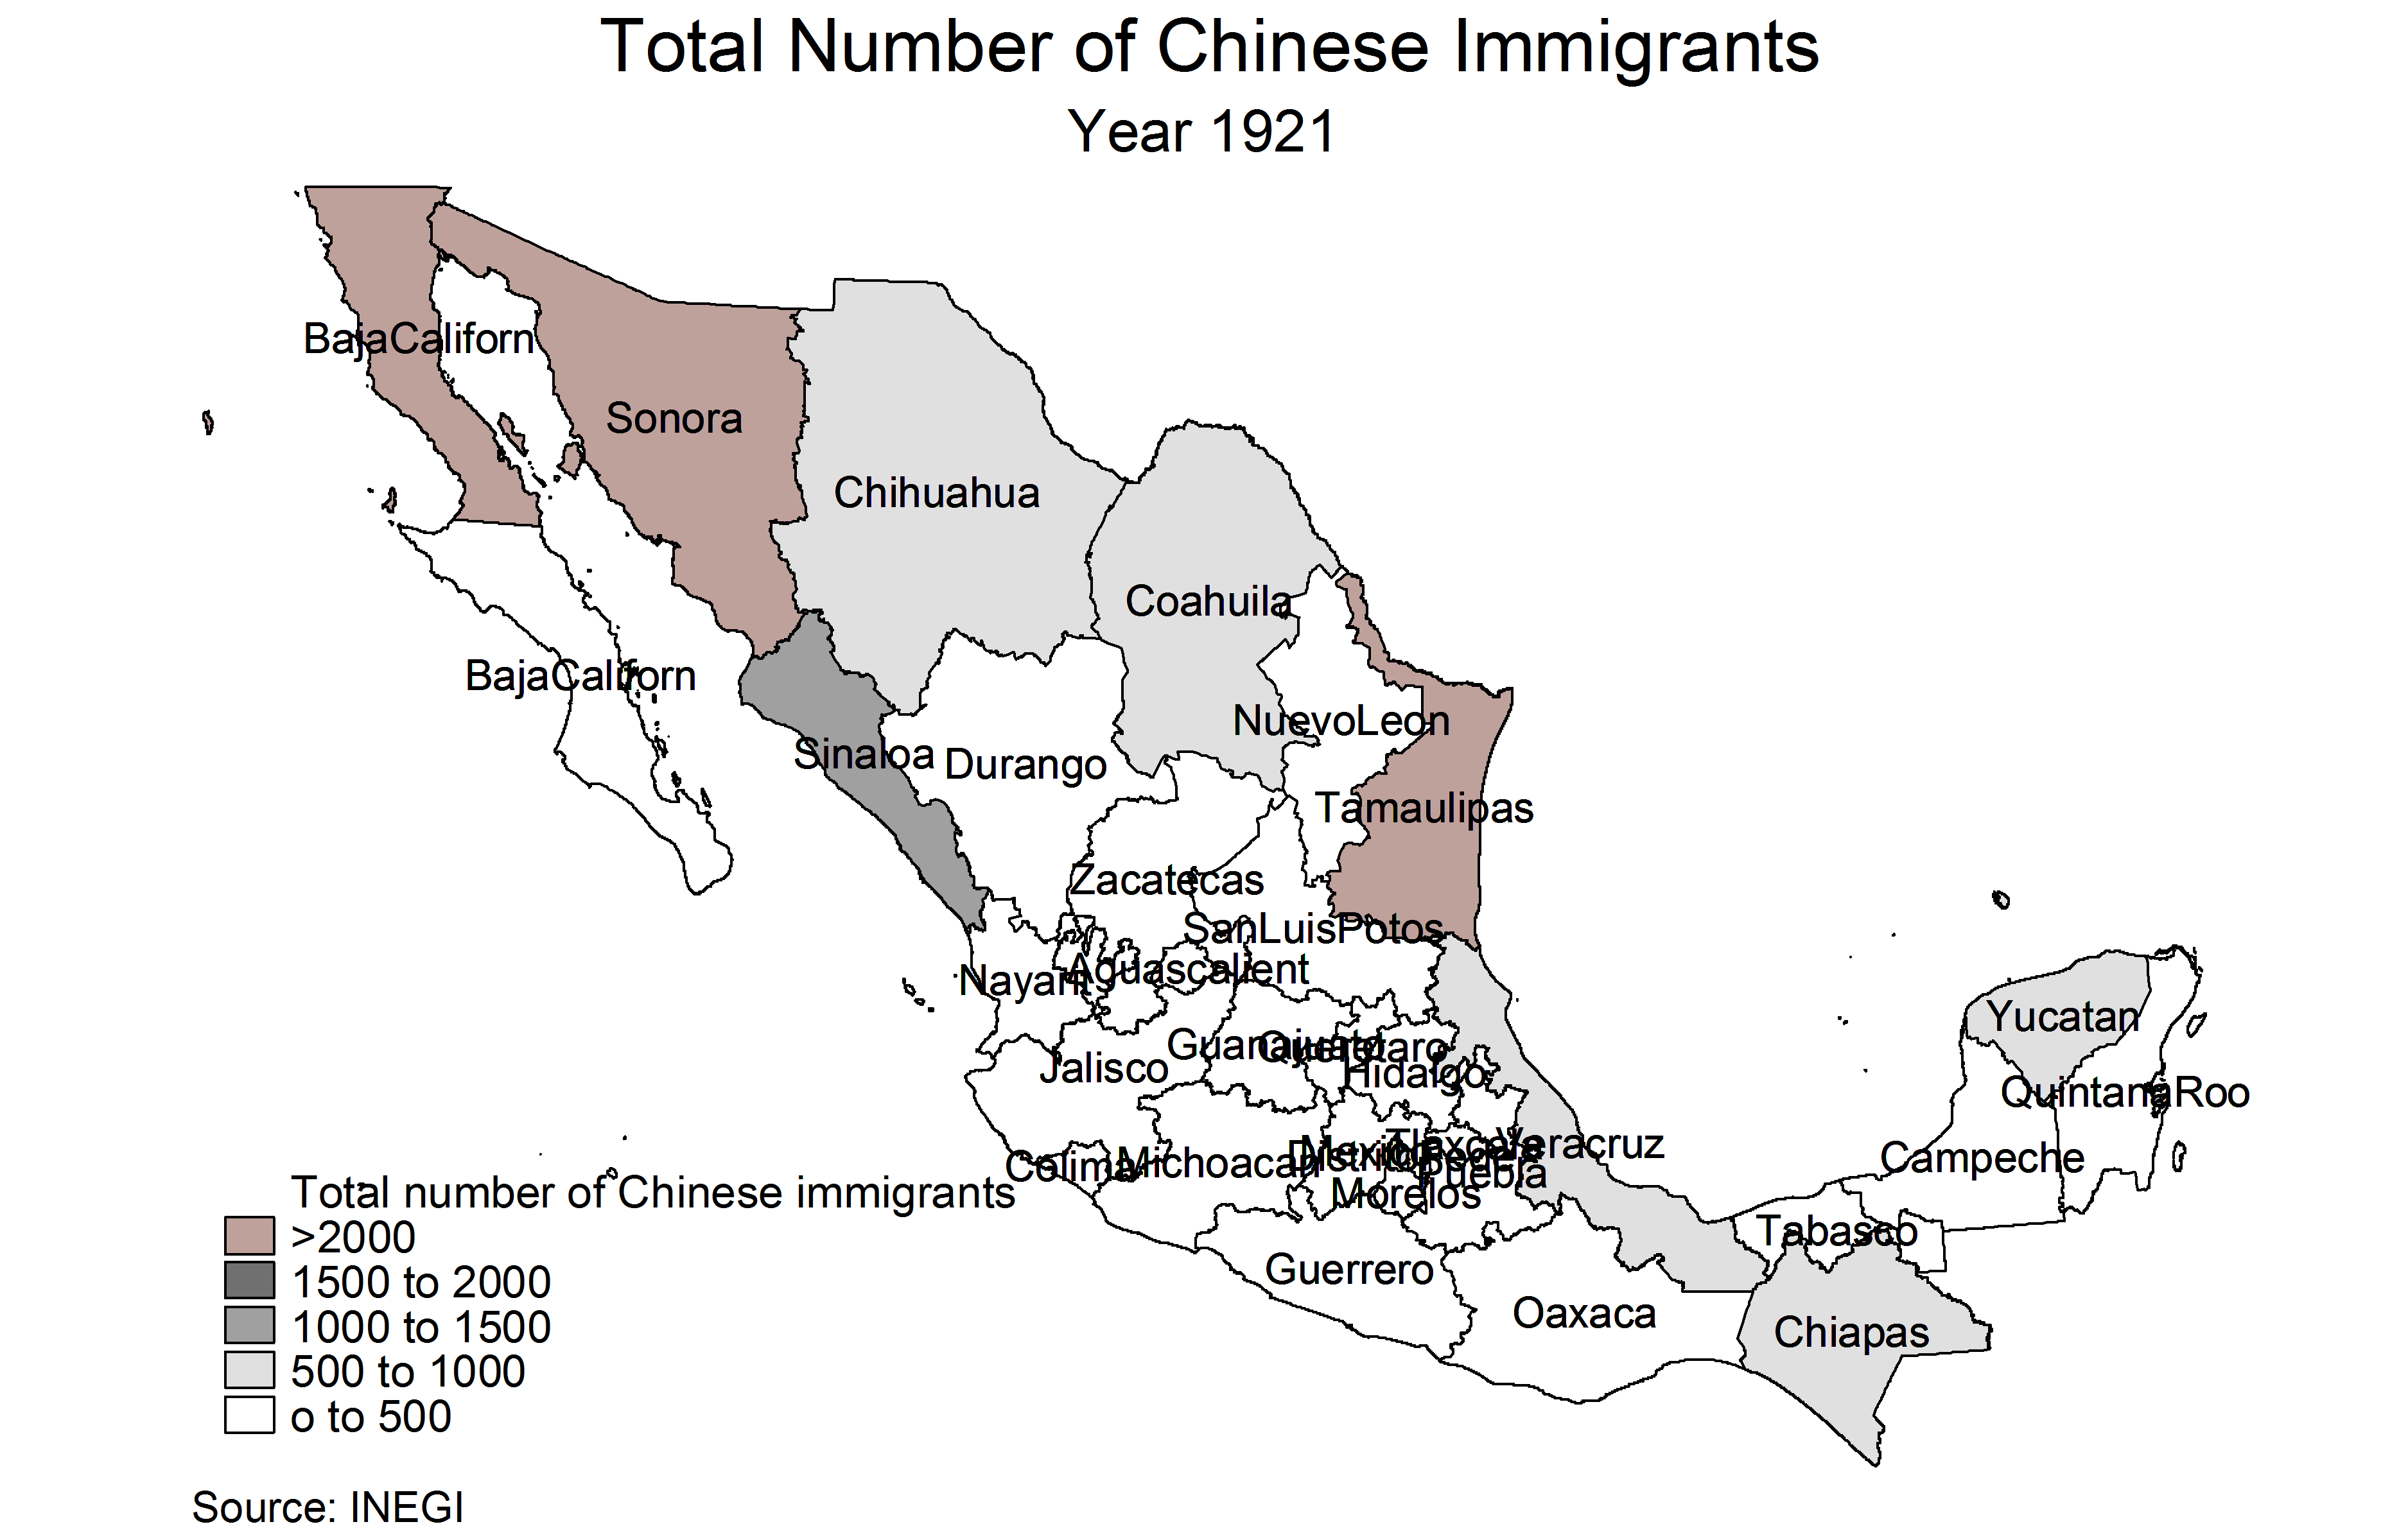
This summer, I had the opportunity to assist Professor Robert K. Brigham with research for his contracted book, which will examine the Clinton administration’s response to mass atrocities and humanitarian intervention.  I began my research by focusing on President Clinton’s response, or lack of response, to the 1994 Rwandan genocide – a conflict that devastated Rwanda and resulted in the estimated death of 800,000 to 1 million Tutsis and pro-democracy Hutus.  This research was most interesting because it revealed how an administration transitioned from originally supporting humanitarian intervention and multilateral cooperation, especially with the United Nations, to an administration that sought to block U.N. attempts to strengthen the United Nations Assistance Mission for Rwanda (UNAMIR).  Most striking, I was shocked to discover the efforts that the administration undertook to deny the genocide, such as instructing U.S. Department of State spokesperson, Ms. Christine Shelly, to use the term “acts of genocide” instead of “genocide” to avoid having to intervene under obligation to the 1948 Convention on the Prevention and Punishment of the Crime of Genocide.  By researching President Clinton’s response to Rwanda, I also became more aware of the relationship between the administration and the United Nations, specifically through U.S. Ambassador Madeleine Albright.  By analyzing primary documents, such as international reports, U.S. Department of State reports, memos, and unclassified confidential cables, I have come to better understand the inner-workings and complex domestic, Congressional, and international pressures exerted upon the Clinton presidency.

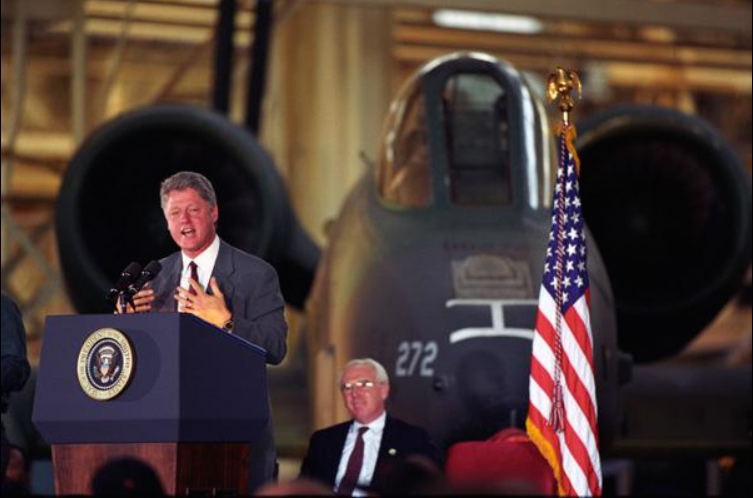
President Clinton Addressing an Audience at the McClellan Air Force Base in October 1993. Photograph courtesy of the U.S. National Archives.

However, from discussions with Professor Brigham, it became clear that the next question to ask was: What caused the Clinton administration to be so hesitant to intervene in Rwanda?  From my findings, it has become evident that President Clinton’s reaction encompasses several decades of U.S. foreign policy that fears intervention and stems from America’s failure in the Vietnam War.  The U.S. learned several lessons from the Vietnam War that include: a need for clear and achievable objectives, Congressional and public support, the need for a focus on human rights, and that a successful military strategy requires an immediate, not gradual, attack.  In addition to these lessons, presidents following Vietnam were forced to deal with a distrust of civilian leadership that emanated from the military and made the military more hesitant to support political objectives abroad.  It was extremely interesting to research how each president dealt with the public’s new dislike for foreign intervention, such as President Carter who emphasized human rights and President Reagan who utilized a realist interpretation of the Vietnam War to restore American confidence in its foreign presence.  Surprisingly, I found my research regarding changes to the military since the Vietnam War to be extremely interesting, such as the Goldwater-Nichols Defense Reorganization Act of 1986 that reorganized the Department of Defense and promoted the Chairman of the Joint Chiefs of Staff to the role of primary military advisor to the president.  Additionally, the Act mandated that the Executive Branch submit an annual National Security Strategy Report, which became a useful primary source for understanding an administration’s foreign policy outlook.  Ultimately, from my research, I concluded that despite the growing confidence of the U.S. in foreign intervention (from the Reagan administration and primarily the success of the First Gulf War), the U.S. military’s humiliation in Somalia during the United Nations Operation in Somalia (UNOSOM) II caused memories of Vietnam to return to the minds of many citizens, including President Clinton.  Thus, a year after UNOSOM II and with the publication of Presidential Decision Directive 25, which revealed the United States’ more selective approach to peacekeeping operations, President Clinton was paralyzed by fears of foreign intervention and unable to responsibly intervene in Rwanda.

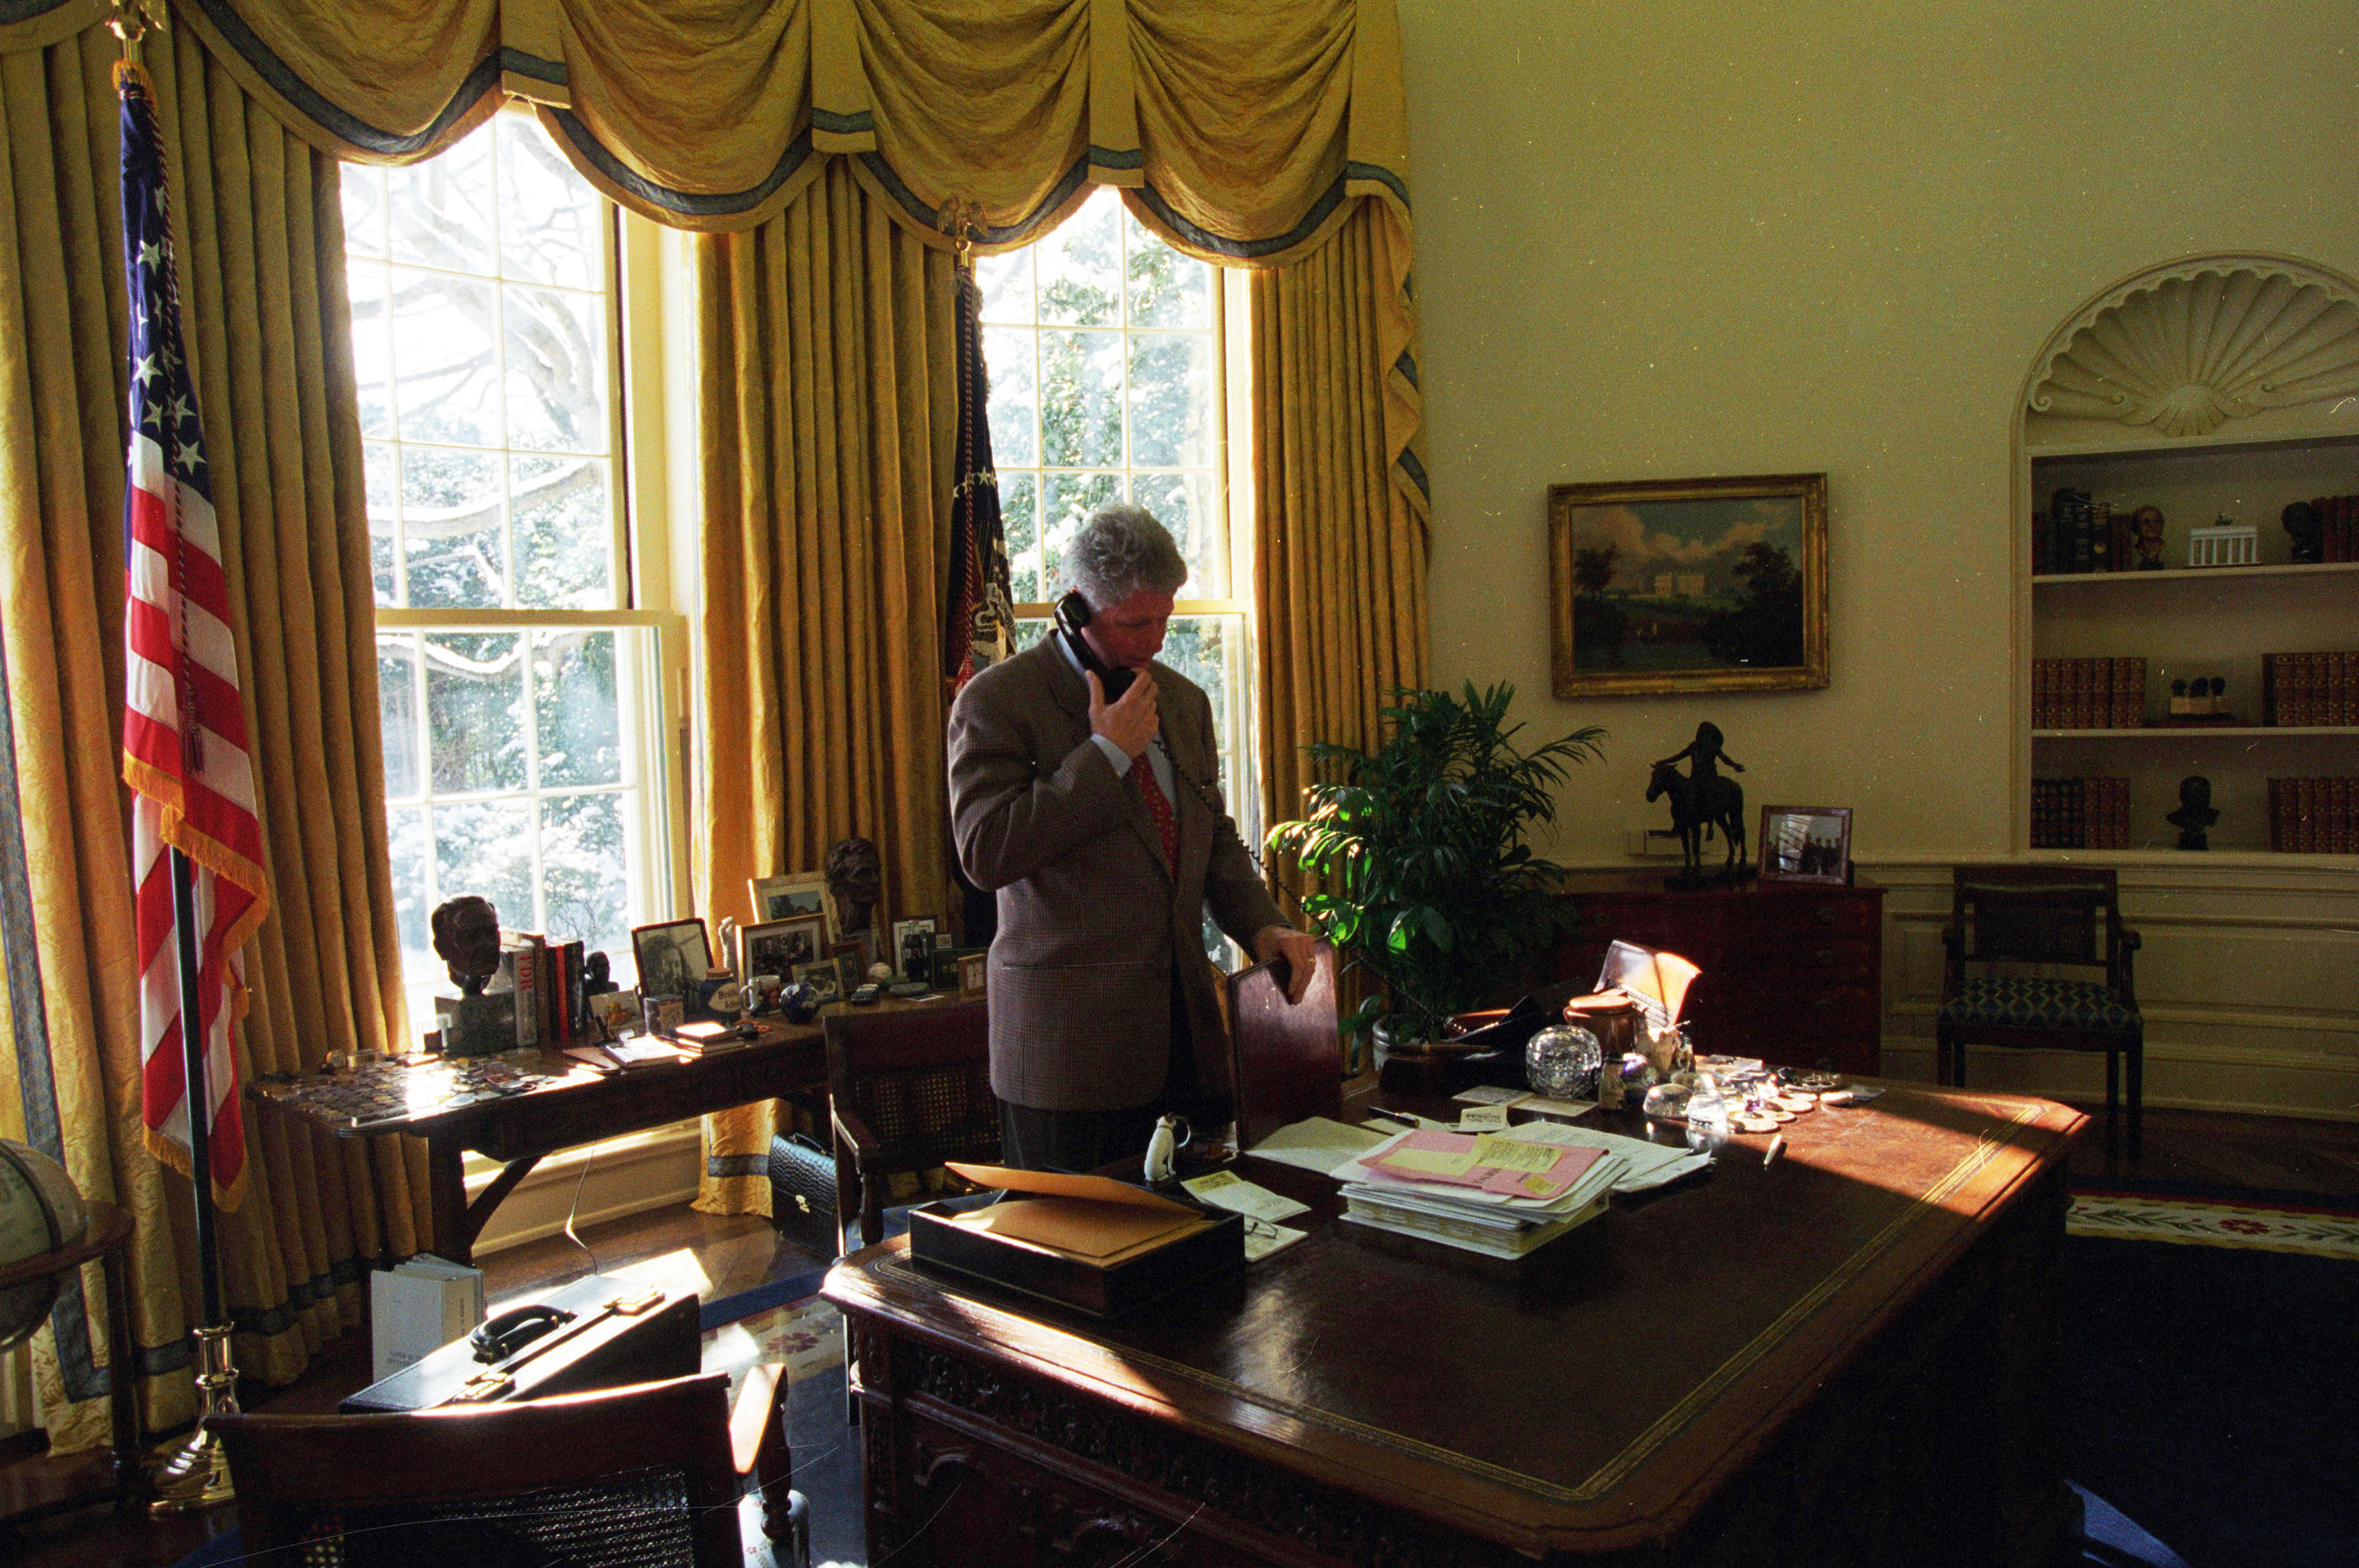
President Bill Clinton in the Oval Office in January, 1995. Photo Courtesy of the William J. Clinton Presidential Library

This research opportunity not only expanded my understanding of U.S. Foreign Policy and the pressures that administrations face, but it also furthered my interest in humanitarian intervention.  From this opportunity to work as a Ford Scholar, I now hope to expand upon my research in a senior thesis and, eventually, continue my interest in humanitarian intervention through post-graduate work.

Internal carbon pricing for achieving carbon neutrality at Vassar

Climate change represents the most daunting crisis our world faces today. Global efforts toward carbon neutrality, however, are not happening fast enough. As a small liberal arts institution, Vassar is well suited to experiment with innovative strategies to reduce its own emissions, and set an example for other organizations. My research explored the feasibility and potential effectiveness of using a carbon tax and/or carbon accounting at Vassar to reduce our carbon footprint. My coworkers and I conducted research on the theory of the ‘social cost of carbon,’ interviewed representatives from companies like Microsoft, Google, and Facebook that have implemented an internal carbon tax, and visited Yale to discuss their innovative carbon charge model that will be implemented this academic year.

Yale's Kroon Building is LEED platinum certified.

Image 1. Yale’s Leed Platinum certified Kroon Building. We received a tour while visiting.

Carbon emissions result in an incurred cost to society. Carbon pricing seeks to internalize this externality by setting a price on the per/ton value of carbon emitted. The EPA calls this price the ‘social cost of carbon,’ and currently estimates the value at $40 per metric ton of carbon dioxide emitted (EPA 2015). Incorporating carbon pricing into operations has the potential to reduce emissions, prepare Vassar for an externally imposed carbon tax, create educational opportunities for students and faculty, and to distinguish Vassar as a leader by setting an example for the rest of the country.

A breakdown of Vassar's 2008-2009 fiscal year emissions. The two primary emissions come from natural gas heating and electricity.

Image 2. Vassar’s 2008-09 fiscal year greenhouse gas emissions breakdown.

Carbon pricing can be incorporated into accounting processes or used as an internal carbon charge. Integrating carbon pricing into accounting could shift capital project decision making from short-term to long-term prioritization by illustrating the relative lifetimes of their carbon footprints. There are two primary models for a carbon charge. The central fund model, currently used at Microsoft, imposes a tax on emission-intensive products like gasoline or electricity. At Vassar, this could mean charging departments directly for their total electrical, heating, or transportation use, and allocating the raised funds for carbon-reduction investments. Alternatively, Yale’s approach redistributes funds between departments based off their relative annual emission reductions, thus achieving “revenue-neutrality” for the college while incentivizing behavioral change.

The feasibility and effectiveness of different models need to be explored further, so a white paper of our findings will be issued and a task force will be created to determine which model, if any, is appropriate at Vassar.

Work cited: U.S. Environmental Protection Agency. “The Social Cost of Carbon.” 2015.  http://www.epa.gov/climatechange/EPAactivities/economics/scc.html

Capturing Canterbury Cathedral

Art historians have long grappled with the challenge of describing, measuring, and representing medieval architecture. Though hundreds of these buildings have been standing for as many years, few records exist of their construction and what drawings have been made rely heavily on simplification and idealization of lines and shapes. In order to measure the buildings, historians had to rely on rulers, plum bobs and string – which is tedious and less than accurate. With the recent development of new technologies, however, today’s art historians have the ability to accurately measure these magnificent constructions.

Cyclone full 2 cropped

Canterbury’s 3D point cloud in Cyclone, a program used to slice the data into manageable sections (the bright colors are due to an intensity mapping mode, rather than scan color)

Professor Andrew Tallon uses laser-scanning technology to scan medieval buildings. With this method, a laser beam measures the distance to each point it hits as it sweeps around the building. These measurements are then mapped in a virtual 3D space as points corresponding in color and location to what they hit – creating a three-dimensional model of the building comprised of millions of tiny data points. From this data, we can trace exact ground plans and section views, based on the fabric of the building itself rather than half-measured, half-deduced information. This new exactness in measurement allows us to capture the reality of the buildings as never before.

In this project, I used the data from this laser-scanning technology to create the first accurate sections of Canterbury Cathedral’s choir, presbytery, and Trinity Chapel.

high altar

Canterbury’s apse and high altar

Why Canterbury? This building is particularly interesting to look at among medieval buildings because of clear progression of style and method with different architects and a uniquely well-documented history of construction, as well as its social and political history as the site of the martyrdom of Thomas Becket. In 1174, when a fire destroyed the Glorious Choir, the monks of Canterbury hired William of Sens to reconstruct the choir, though after he fell from the scaffolding a few years later, the monks replaced him with William the Englishman as new architect. The development in design between the two master builders and even within each one’s contribution is evident in the building’s construction. Not only is this clear progression of ideas evident in the building, it is documented by Gervase, a contemporary monk thought to have been involved in the construction. Such documentation of the building process is incredibly rare, and helps us understand the thought processes and ideas of the builders and monks at the time. In this way, the building presents a unique opportunity to read changes in ideas, aesthetic, and method in actual data of the building as well as from a rare account of the architectural progress of the building by someone involved. Furthermore, its long role as a pilgrimage site for Thomas Becket gives it a historical significance that makes Canterbury a fascinating building to study, both architecturally and historically.

Rev. Robert Willis' 1845 section of the choir after and before the fire of 1174

Rev. Robert Willis’ 1845 section of the choir after and before the fire of 1174

To date, there has been no accurate representation of the building. Most art historians have based their studies off of Reverend Robert Willis’ account of the building from 1845. This account, detailed though it is, is limited because of the inaccuracy of measurement and representation. Historians are unable to examine the actual reality of the building based on Willis’ account, as it does not represent the building as it has shifted and settled over the centuries.

This project changes this. With laser scanning technology, we are able to document the real dimensions of Canterbury Cathedral to an accuracy of several millimeters. The laser scans create millions of data points in a virtual 3D space that can be sliced, rotated, and moved through, allowing us to examine the building as never before – as an accurate three-dimensional model on a computer screen. However, at this stage, the data is only a cloud of points – intriguing to explore, but often unclear and difficult to read. In this project, I converted the Canterbury point cloud into usable section views by tracing the data in AutoCAD.

Data slice through the choir with drawing overlay

Data slice through Canterbury’s choir with drawing overlay

Doing this, however, is not as easy as connect-the-dots. At times the data was confusing as to what the points might represent, or in places where the laser was blocked, I was forced to extrapolate what it might look like by exploring the 3D points renderings and comparing that to spherical panoramic images of each of the scanning locations. One of the greatest challenges I faced with this project was trying to represent three dimensions in two – a challenge when, for example, vaults project in a curve into our space. In addition, no part of the building is perfectly lined up – columns are out of line, arches are at odd angles to each other. Often, I was faced with a decision between accuracy and clarity. At times, in order to show something useful in the sections I drew, it required the elimination of a detail or collapsing several section planes into one. In this sense, though  these new drawings’ measurements are more accurate than ever before, the drawings are nonetheless filtered in order to create as understandable a section as possible – a dilemma impossible to solve in this type of representation.

Even with these challenges, these section drawings of Canterbury Cathedral are the most accurate to date. With these new sections, art historians can study the building based on real data rather than simplified models of the building. Not only are drawings such as these useful for studying the building in an art historical sense, they are also useful for upkeep and maintenance. For example, laser scanning can reveal points of weakness in the building caused by the thrust of the vaults and which columns or buttresses are working against that stress. Both in physical and historical analysis of Canterbury Cathedral, the greater accuracy of these scan-based drawings is the key to a better understanding of the building.

This project resulted in the first three accurate section views of Canterbury, but the work is far from finished – Canterbury has yet to have an accurate ground plan drawn, and exact elevation drawings would also be a first. A simple three-dimensional model based on this data would also be a powerful tool to study the building in new ways. Those will be the next stages in this project, where we use laser-scanning technology and AutoCAD to capture Canterbury Cathedral as never before.

The completed drawing of Canterbury’s Trinity Chapel: vaults are light pink to indicate their projection into space. White lines mark what could not be read from the laser scan and had to be estimated.

For a glimpse of how laser scanning technology is used to analyze buildings, take a look at the National Geographic article on Professor Tallon’s analysis of the National Cathedral.


The Culture of Competition

Competition weaves a thread between all individuals who are associated with it: parents, coaches, referees, and competitors. The manner in which this thread is comprised influences what happens on the field in the heat of competition; interestingly enough, each individual that’s involved with a team, though s/he may never put on a uniform, holds a personal stake in the success or downfall of any team.

Over 21 million youth are involved in playing travel sports (The Aspen Institute, 2014).

Over 21 million youth are involved in travel sports (The Aspen Institute, 2014).

Throughout the course of this year, I followed three youth travel teams. This summer, I had the opportunity to focus my efforts mainly on observing the practices and games of a high school basketball girls travel team. Lauren Wiebe (Ford Scholar for Professor Chris Bjork) and I conducted ethnographic research at the team’s practices and competitions, taking note of everything that I heard and saw while at their events. I began to pick up on the patterns of interaction that existed between each individual of the organization, whether that was a parent, a coach, or a player. Slowly, I became part of their community and witnessed firsthand the culture of competition in youth travel sports. My ethnographic research culminated in gathering information on parents’ expectations of their children in athletics as well as their degree of involvement in these programs. Professor Bill Hoynes, my faculty mentor, and Professor Chris Bjork are handing out our surveys to more parents over the summer to gather more responses before we analyze our data in the fall.

Many parents see athletic participation as a stepping stone to get into college,

Many parents see sports as a stepping stone to get into college, with the hopes of seeing their child receive an athletic scholarship.

One of the biggest attractions in becoming involved with competitive travel sports programs is the allure of gaining an athletic scholarship to cover the cost of receiving a college education. My individual research this summer was centered around determining the effects of travel sports on collegiate recruiting. I interviewed eight athletic administrators, college coaches, and club directors from around the country to begin collecting information for a chapter that focuses on collegiate recruiting in Professor Hoynes and Professor Bjork’s future book. Travel teams are viewed as the “necessary evil,” as they are essential for providing the visibility required in the recruiting identification process, but come with making large financial sacrifices. Future research will be conducted within this year to further explore issues of access within travel sports and how travel sports impact the student-athlete population at colleges throughout the United States.


Evaluating Food Justice Initiatives

migrant farmer

This summer I undertook a project under the supervision of Canidce Lowe Swift that evaluated existing initiatives for food justice. In this case, we studied a small facet of the food justice world, which was justice for farm workers. To do this, I conducted participatory observation by interning with the Rural and Migrant Ministry (RMM). This is a nongovernmental organization that works for equality and justice for rural and migrant workers in the Hudson valley, in partnership with other branches that work for the larger New York area. Migrant farmers are those farm laborors who might move from farm to farm each season or each year, sometimes from other parts of the country, and often from other parts of the world. My first goal was to understand the conditions that create inequality for migrant workers. What governmental and social attitudes exist now that contribute to the extreme poverty that many migrant farmers live in? These issues include issues of immigration documentation, language barriers, lasting effects of slavery, and racism which manifest themselves in coercive and oppressive labor conditions. We also aimed to understand the existing projects that the RMM is undertaking in terms of achieving political and social change. How does the organization address the multifaceted issues facing farm workers? I studied, therefore, the political demonstrations, organizations, and actions that are coordinated by the RMM. In addition, I became involved with several different projects within the RMM, which included a very large focus on empowering youth who come from rural or migrant families. Lastly, I studied the function of the office as a case study for the demographics who are involved in working for justice, wether farm workers themselves were present, and how this may or may not have affected the organizations efficacy. Overall, I discovered that the group does and incredible amount for empowering voices for the future, and for attempting to influence policy. The RMM, however, was at times out of touch with the diverse groups of peoples that comprise farm laborers, often have a limited base for their own research due to the way in which the workers make connections within the farm community, and undertake very little poverty relief type aid. However, I see the last issue as the difference between charity work and social justice work, or good distribution versus empowerment. This fall I am continuing my work with the RMM for both personal and academic reasons, hoping to understand these issues for further research with my professor, and for understanding my role in social justice initiates in the future.

The Cost of Financial Crises: A Sectoral Analysis

My Ford Scholars project this summer was focused on the effects of different types of financial crises (systemic banking, exchange rate and sovereign debt crises) on sectoral value added and employment. Even though a large amount of literature has been dedicated to exploring the impact of crises on the overall level of output, only few papers research the changes in the individual sectors. In this context, the paper “The Cost of Financial Crises: A Sectoral Analysis” provides a relevant contribution to the existing literature by estimating the magnitude of the effect of crises on agriculture, industry and services.

Working with Professor Islamaj, we collected data on sectoral value added and employment from the World Bank and the Groningen Growth and Development Center database and used Stata (a statistical software) to perform analysis on the effect of the occurrence of crises episodes in both emerging markets and developing economies. The data on crises is obtained from three main data sources – Levi-Yeyatti and Panizza, Leavan and Valencia, and Reinhart and Rogoff. The preliminary research showed evidence that banking crises lead to longer recoveries in sectors heavily dependent on external finance. Furthermore, exchange rate crises do not have as severe effect on sectors that are primarily export-oriented because currency depreciation increases firms’ competitiveness. Our results are consistent with these hypotheses.

Another method of determining the differences in the cost of financial crises across sectors is by looking at the duration and amplitude of the sectoral “episodes”, where duration is defined as the time period during which sectoral value added decreases and similarly, amplitude is defined as the change in value added in the year following the occurrence of a crises. The two tables below show our findings. The industrial sector is more severely affected by debt and banking crises, with drop in output lasting 0.588 and 0.524 years on average. However, the results for amplitude show a larger negative impact of banking crises compared to debt crises (1.47% and 0.55% respectively). In addition, banking crises leads to an increase in the value added of agriculture and a decrease in the service sector. Interestingly, value added in the three sectors increases after the occurrence of a currency crises.

Table 1:  Crises Duration

Table 1: Crises Duration

Table 2: Crises Amplitude

Table 2: Crises Amplitude

My involvement in the project consisted primarily of carrying out a literature review on previous papers researching similar and related topics, obtaining and organizing data, and writing do-files (text files containing commands to be executed by the statistical software Stata).

Embodying Compassion in Buddhist Art

Embodying Compassion in Buddhist Art: Image, Pilgrimage, Practice

White-Robed Guanyin 1982.3.3

This coming spring, the Frances Lehman Loeb Art Center at Vassar College will host an exhibition centered on the topic of Avalokiteshvara, the bodhisattva of compassion. Professor Lucic and I spent the summer working on planning and research for this exhibition, a multifaceted job.

Research was an important part of my work as a Ford Scholar, particularly finding and organizing research on the various works of art. The bibliography of the exhibition’s catalog was a huge undertaking. The process of creating and editing a bibliography of this size is extremely time consuming, but also very important, as the sources that we cite will be useful for people trying to find further information on these works. This exhibition features an incredible collection of works from all over the world, and will therefore be very important for scholars or students trying to gain a further understanding of imagery of Avalokiteshvara.

Eleven-Headed Arya Avalokiteshvara 2001-90-1

One large part of my work was correspondence with various organizations regarding rights for reproductions of images of the works that we would be using in the catalog. The complexity of the bureaucratic aspects of organizing an exhibition was a surprise to me as a student of Art History. Negotiations regarding the conservation of works of art, the cost of transportation or care, the reproduction of images and the credit given to organizations took up a lot of my time. This was extremely interesting, particularly because it was a first glimpse in to the reality of working in the art world.

I also had the chance to collaborate with Professor Lucic on the creation of a website and smartphone application related to the exhibition, which will be released with the catalog and exhibition. Work on the website, smartphone application, catalog, and exhibition is ongoing, as Professor Lucic works with a class of Vassar students in her seminar, Embodying Compassion in Buddhist Art: A Curatorial Training.

One Hundred Images of Amida Buddha 2009.3.

Relationship between Level of Integration and Firm’s Competitiveness

This summer I have been working with Professor Evsen Turkay on the project that studies the relationship between a firm’s competitiveness and the level of integration between the upstream firm and downstream firm. We define the level of integration by evaluating how closely up and downstream firms are interrelated. The more interrelated the firms are, the higher level of vertical integration. Our hypothesis has been that, because higher level of vertical integration implies more information exchanges between the upstream and downstream firm, the better chance it will be for the upstream firms to avoid uncertainty and risk in research and development because they have better information about what products are being demanded at the moment. As a result, they tend to be more competitive and will take up more market share than other firms.

Global Lithium Ion Battery Market Share by Country

World Battery Manufacture Market Share

We started our research by getting the market information of lithium-ion battery industry (upstream firms) in which we discovered that: 1. Although U.S. has been the top-notch developer of technology in this area, Asian firms took the largest market share.  2. Asian firms seem to be more vertically integrated than the U.S. firms. 3. Other kind of advantages of Asian firms, such low labor costs, do not take a huge share in entire cost of production. 4. Other costs in production, such as material costs, are not basically the same for firms all over the world. All the information allows us to make the corollary that level of vertical integration decides the outcome of such unbalanced market share.

Then we took automobile industry (electric automobile industry) as the downstream firms of our research and found the market share of those automobile manufacturers. We then researched the relationship between those electric car manufacturers and lithium-ion battery providers and classified their relationships according to closeness of their corporation from the degree 0 to 3. “3” represents the greatest level of integration, usually the relationship between a mother firm and its subsidiary and “0” represents basically no close relationship between up and downstream firms. We discovered that in the downstream market, the firms which have at least some kind of vertical integration (degree range from 1.5-3) for example, joint venture and some research agreement takes up 78% of the market share which shows the advantage of such high vertical integration and affirms our hypothesis. We also looked through small electronic markets such as cellphone market, laptop market, and tablet market, which also use lithium-ion batteries and got the same result.

1

Improvement that should be Made and Afterwards:  all the hypothesis and corollary we got above requires too many assumptions that are shouldn’t be ruled out in the real world. We have tried to eliminate them through more careful research on price, unit cost, research and development costs of those upstream firms and hoped to fit them in the model that professor Turkay constructed. However, we were not able to do so because most of such information is commercially confidential. We also discovered that, there could be other factors that cause the resulting market share even though we have eliminated many of them. Next step will be to find more factors that will probably affect the outcome of our research and find other ways of searching those data.

Knowledge Spillovers and Illegal Production: The Case of Opium Production in Mexico

It is believed that opium production in Mexico began in the late 19th century and trafficking to the U.S. in the early 20th century. While illegal drug production in Mexico has been under the spotlight for a longtime, immigration knowledge spillovers on such activities are a rather unique way to look at this issue. This summer I worked with Professor Sarah Pearlman and her co-author Emily Owens on a research project focusing on the role that knowledge spillover from Chinese immigration to Mexico played on the development of Mexican opium production.

From reviewing relevant history papers and literatures, we have gained insights about factors contributed to Chinese immigration to Mexico and its geographical distribution. After the British abolishment of slave trade in 1830s, the United States received a large amount of Chinese laborers due to Gold Rush and First Transcontinental Railroad. However, the 1882 Chinese Exclusion Act restricted the entry of Chinese to the United States. Chinese population, especially in California where over 80% Chinese born population in US resided in 1880, experienced a dramatic drop in terms of both total and percentage population. In the meantime, modernization movement in Mexico created domestic labor shortages, resulting in more welcoming immigration policies such as offering citizenship to Chinese migrants. As a result, Chinese population in Mexico showed consecutive increase and reached peak on 1920, according to historical census data from the Instituto Nacional de Estadistica y Geografia (INEGI) in Mexico.

immigration_total

(Total number of Chinese immigrants in Mexico; Source: INEGI)

We analyzed INEGI’s census data from 1895 to 1940 in STATA. We found out that northern states were target destinations of this inflow of Chinese immigration in Mexico, while the majority of total national population at that time was located in the south near Mexico City. Due to social and economic ties between Chinese immigrants in the US (especially California) and Mexico, as well as the fact that Mexico was the first step of illegal entries to the US for some Chinese immigrants, most of destination states are boarder States. For instance, Sonora is at the south of Arizona and Baja California is next to California. We have constructed maps to visually illustrate this concentrated distribution by merging GIS information into STATA

.1

Interestingly, our preliminary assessment of opium poppy cultivation trends in Mexico shows that many popular destinations of Chinese immigrants are now major opium producing states. Chihuahua, Durango and Sinaloa are top states in terms of poppy plant seizures according to Mexican government records in 2005. Since current poppy cultivation is influenced by field visibility, effectiveness of law enforcement, eradication efforts and other factors as poppy cultivation became illegal in 1926, we looked back to historical data about poppy cultivation, preferably before 1930. From Penafiel Yearbook of Mexico obtained from archives in UCLA library, I found municipal level agricultural census of various crops, yet poppy was not recorded. These census data may help us in comparing distributions of poppy and plant whose suitability is similar to poppy. I also found state level opium production from the same documents. Meanwhile, we are trying to construct an index of agro-climatic suitability for poppy in order to locate areas in Mexico that are naturally suitable for poppy cultivation. To aid the research I consulted geography professors and collected maps from atlas and some GIS files.

Although up till now the relationship between immigration and opium production in Mexico remains unclear, throughout the summer we have well traced Chinese immigration inflow to Mexico and understood reasons of this migration, which are essential fundamentals for future research on this topic. 

Online Experiments with the Behavioral Economics of Social Systems

Overview: My primary research this summer was with Benjamin Ho on a project about the value of explanations in social settings. For example, let’s say you take the last cookie from the cookie jar. Once someone notices the last cookie missing, there are a variety of ways in which you might explain yourself: apology (“I’m sorry!”), guilt (“Oops, I feel terrible!”), and selfishness (“Too bad, I wanted the cookie!”) amongst others. We set out to determine the different types of explanations people give, the circumstances in which they arise, the strategies that people employ when explaining themselves, and whether people actually change their behavior as a result of past explanations (i.e., after saying sorry, one might expect less selfish behavior).

Process: First, we needed a way to obtain explanations. For this, we created an online survey (http://goo.gl/xtshAl) and turned to Amazon Mechanical Turk (MTurk), a crowdsourcing platform, to send it to people all over the country. Participants in the experiment are given money for completing simple tasks. They then have the option to take money from other participants, profiting more for themselves at the expense of others. After they make a decision about how much money to take, participants are asked to explain their actions to their partners. Some of the “takers” know about this explanation ahead of time; they have more information on the basis of which to make decisions regarding how much money to take. In other treatments, we vary the takers’ ability to pay to avoid sending an explanation or to guarantee that an explanation is sent. The experiment is then repeated three times with different people. Lastly, we vary both the money awarded to takers (ascending vs. descending payoffs in each round) and the timing of the explanation in the experimental process.

Brief summary of results: We obtained over 1850 responses in the three rounds of our survey. Five MTurk users sorted each explanation we collected, and tests for robustness confirmed adequate sorting. Below is a summary of people’s take rates versus the type of explanation they gave.

We found that a majority (55%) of people wanted to take any money at all from their partners, suggesting that many people are unselfish, even when using a platform like MTurk that is designed solely for their profit. Of those who took any money, the average take rate was around 45%, but it varied wildly by type of explanation sent. Those apologizing or admitting to selfishness took the most; those who were honest or fair in their explanation took the least; those who admitted to being guilty took the average. Only 11% wanted to pay to make sure their explanations were or were not sent, and most of these people tended to send guilty explanations even though guilty people behaved in the most average manner of any group of explanation-senders. We did not find largely significant changes in behavior across rounds of the experiment, so there is evidence to suggest that people’s behaviors are not calculated in a split second but rather formulated in a longer-term way. Additionally, people who were informed ahead of time about the future explanation took less than average by about 12%, and those who could pay to avoid the explanations took more than average by over 5%.

Afterwards & moving forwards: I gave a talk explaining these results at the BEEMA conference at Haverford this June entitled “The Present Value of Future Explanations.” In addition, the Economics faculty at Vassar have helped us greatly in the process of designing our experiment and analyzing our findings. As we finalize our understanding of the mechanisms at work behind people’s behaviors in the context of explanations, I will be writing up our results for publication sometime this fall.