
Art historians have long grappled with the challenge of describing, measuring, and representing medieval architecture. Though hundreds of these buildings have been standing for as many years, few records exist of their construction and what drawings have been made rely heavily on simplification and idealization of lines and shapes. In order to measure the buildings, historians had to rely on rulers, plum bobs and string – which is tedious and less than accurate. With the recent development of new technologies, however, today’s art historians have the ability to accurately measure these magnificent constructions.
-
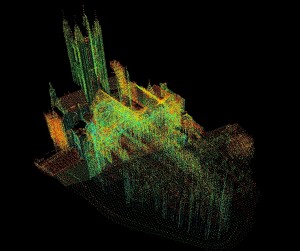
Canterbury’s 3D point cloud in Cyclone, a program used to slice the data into manageable sections (the bright colors are due to an intensity mapping mode, rather than scan color)

Professor Andrew Tallon uses laser-scanning technology to scan medieval buildings. With this method, a laser beam measures the distance to each point it hits as it sweeps around the building. These measurements are then mapped in a virtual 3D space as points corresponding in color and location to what they hit – creating a three-dimensional model of the building comprised of millions of tiny data points. From this data, we can trace exact ground plans and section views, based on the fabric of the building itself rather than half-measured, half-deduced information. This new exactness in measurement allows us to capture the reality of the buildings as never before.
In this project, I used the data from this laser-scanning technology to create the first accurate sections of Canterbury Cathedral’s choir, presbytery, and Trinity Chapel.
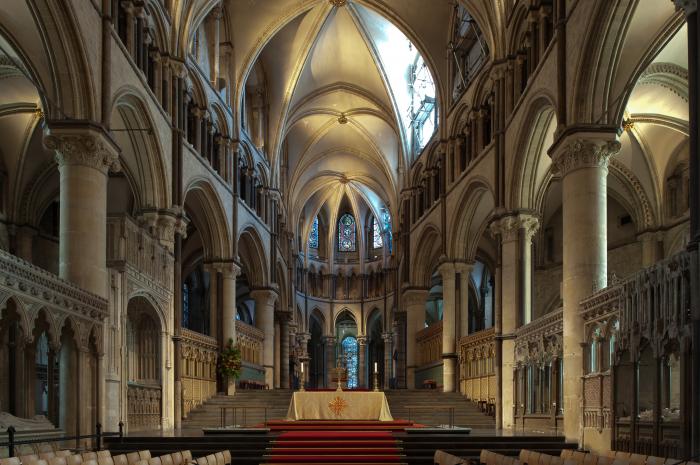
Canterbury’s apse and high altar
Why Canterbury? This building is particularly interesting to look at among medieval buildings because of clear progression of style and method with different architects and a uniquely well-documented history of construction, as well as its social and political history as the site of the martyrdom of Thomas Becket. In 1174, when a fire destroyed the Glorious Choir, the monks of Canterbury hired William of Sens to reconstruct the choir, though after he fell from the scaffolding a few years later, the monks replaced him with William the Englishman as new architect. The development in design between the two master builders and even within each one’s contribution is evident in the building’s construction. Not only is this clear progression of ideas evident in the building, it is documented by Gervase, a contemporary monk thought to have been involved in the construction. Such documentation of the building process is incredibly rare, and helps us understand the thought processes and ideas of the builders and monks at the time. In this way, the building presents a unique opportunity to read changes in ideas, aesthetic, and method in actual data of the building as well as from a rare account of the architectural progress of the building by someone involved. Furthermore, its long role as a pilgrimage site for Thomas Becket gives it a historical significance that makes Canterbury a fascinating building to study, both architecturally and historically.
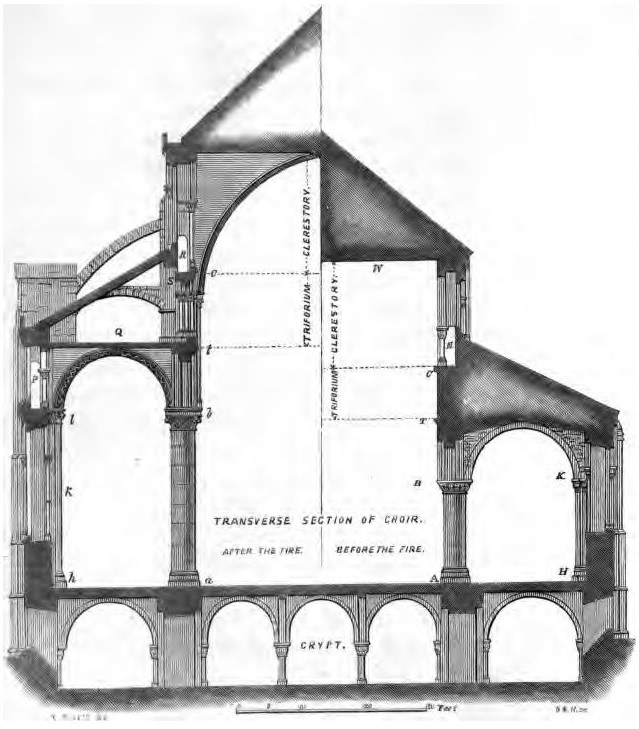
Rev. Robert Willis’ 1845 section of the choir after and before the fire of 1174
To date, there has been no accurate representation of the building. Most art historians have based their studies off of Reverend Robert Willis’ account of the building from 1845. This account, detailed though it is, is limited because of the inaccuracy of measurement and representation. Historians are unable to examine the actual reality of the building based on Willis’ account, as it does not represent the building as it has shifted and settled over the centuries.
This project changes this. With laser scanning technology, we are able to document the real dimensions of Canterbury Cathedral to an accuracy of several millimeters. The laser scans create millions of data points in a virtual 3D space that can be sliced, rotated, and moved through, allowing us to examine the building as never before – as an accurate three-dimensional model on a computer screen. However, at this stage, the data is only a cloud of points – intriguing to explore, but often unclear and difficult to read. In this project, I converted the Canterbury point cloud into usable section views by tracing the data in AutoCAD.
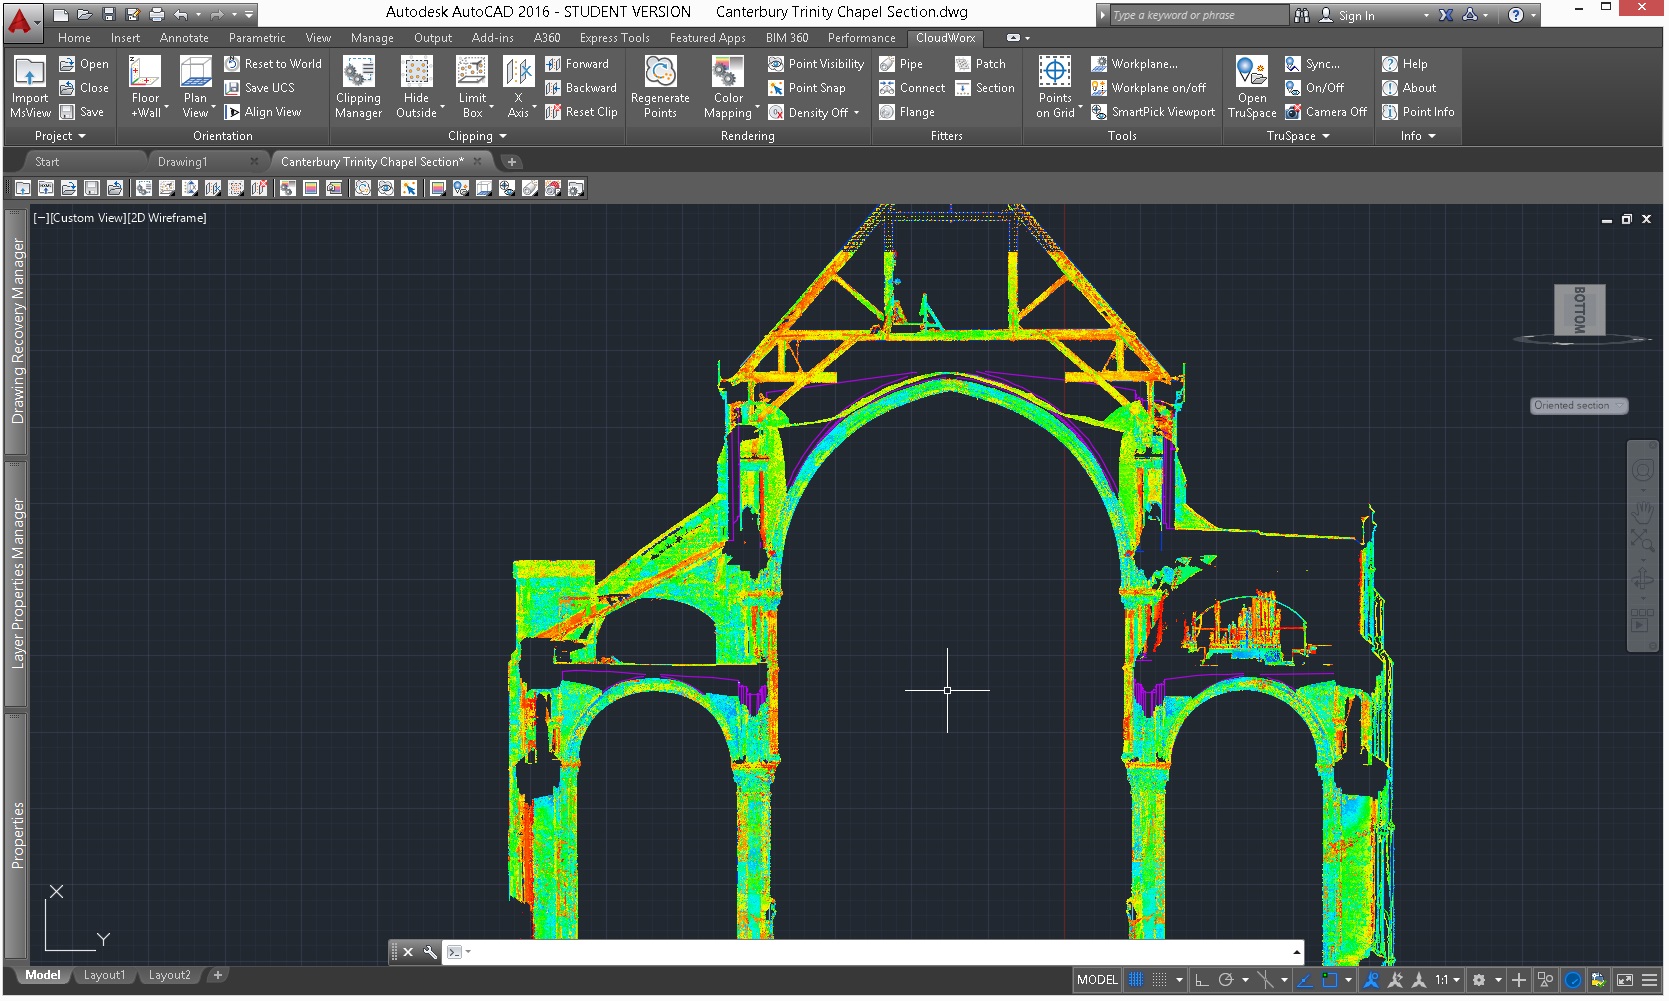
Data slice through Canterbury’s choir with drawing overlay
Doing this, however, is not as easy as connect-the-dots. At times the data was confusing as to what the points might represent, or in places where the laser was blocked, I was forced to extrapolate what it might look like by exploring the 3D points renderings and comparing that to spherical panoramic images of each of the scanning locations. One of the greatest challenges I faced with this project was trying to represent three dimensions in two – a challenge when, for example, vaults project in a curve into our space. In addition, no part of the building is perfectly lined up – columns are out of line, arches are at odd angles to each other. Often, I was faced with a decision between accuracy and clarity. At times, in order to show something useful in the sections I drew, it required the elimination of a detail or collapsing several section planes into one. In this sense, though these new drawings’ measurements are more accurate than ever before, the drawings are nonetheless filtered in order to create as understandable a section as possible – a dilemma impossible to solve in this type of representation.
Even with these challenges, these section drawings of Canterbury Cathedral are the most accurate to date. With these new sections, art historians can study the building based on real data rather than simplified models of the building. Not only are drawings such as these useful for studying the building in an art historical sense, they are also useful for upkeep and maintenance. For example, laser scanning can reveal points of weakness in the building caused by the thrust of the vaults and which columns or buttresses are working against that stress. Both in physical and historical analysis of Canterbury Cathedral, the greater accuracy of these scan-based drawings is the key to a better understanding of the building.
This project resulted in the first three accurate section views of Canterbury, but the work is far from finished – Canterbury has yet to have an accurate ground plan drawn, and exact elevation drawings would also be a first. A simple three-dimensional model based on this data would also be a powerful tool to study the building in new ways. Those will be the next stages in this project, where we use laser-scanning technology and AutoCAD to capture Canterbury Cathedral as never before.
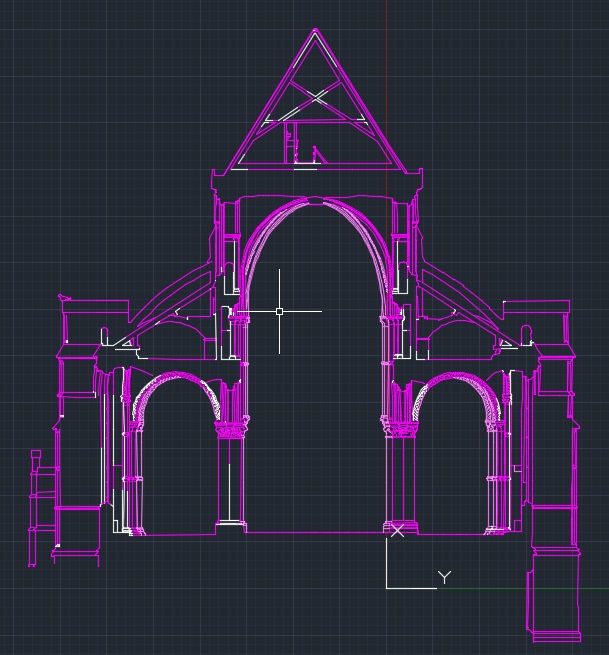
The completed drawing of Canterbury’s Trinity Chapel: vaults are light pink to indicate their projection into space. White lines mark what could not be read from the laser scan and had to be estimated.
For a glimpse of how laser scanning technology is used to analyze buildings, take a look at the National Geographic article on Professor Tallon’s analysis of the National Cathedral.