 For 25 years the United Nations Development Programme (UNDP) has been compiling information about human capabilities (opportunities and the availability of choices) that contribute to the The Human Development Approach, rather than simply the richness of the economy in which human beings live into an annual report called the UNDP Human Development Report (HDR). The data from the 2014 Human Development Report was compiled into GIS format for a Geography class mapping exercise, and is available to any Vassar student or faculty member who wishes to use it.

Percent population below national poverty level (click to enlarge)
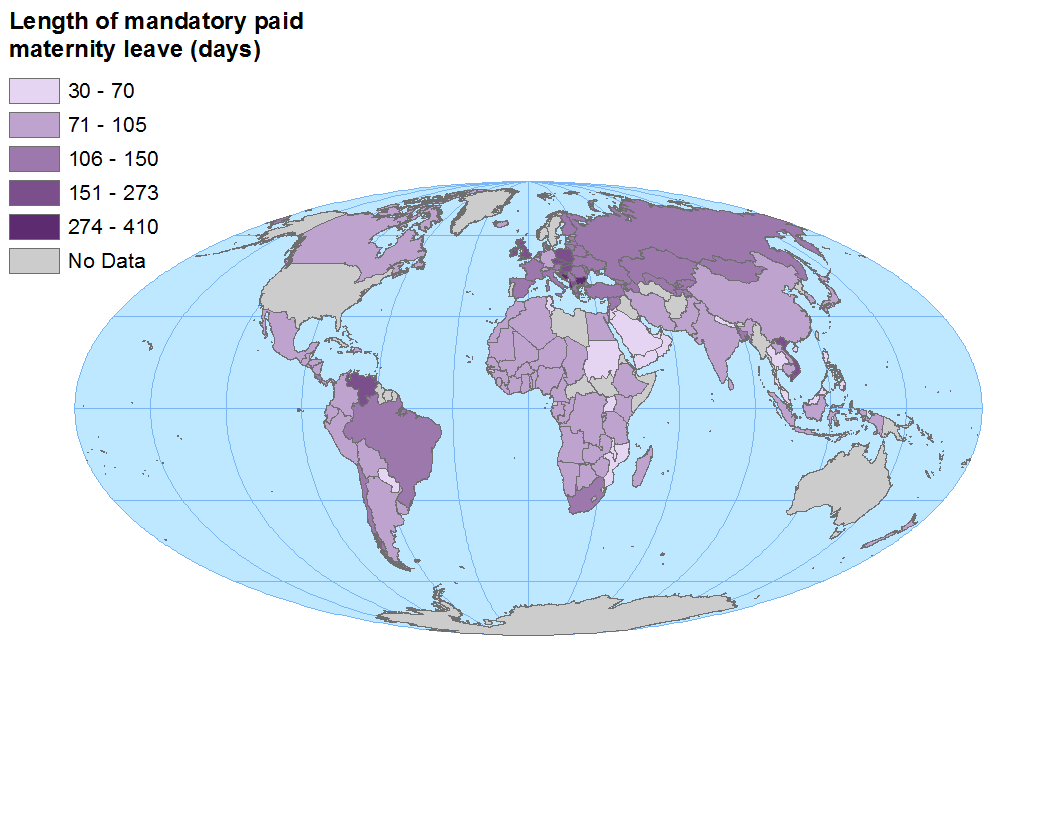
Length of mandated paid maternity leave in days (click to enlarge)
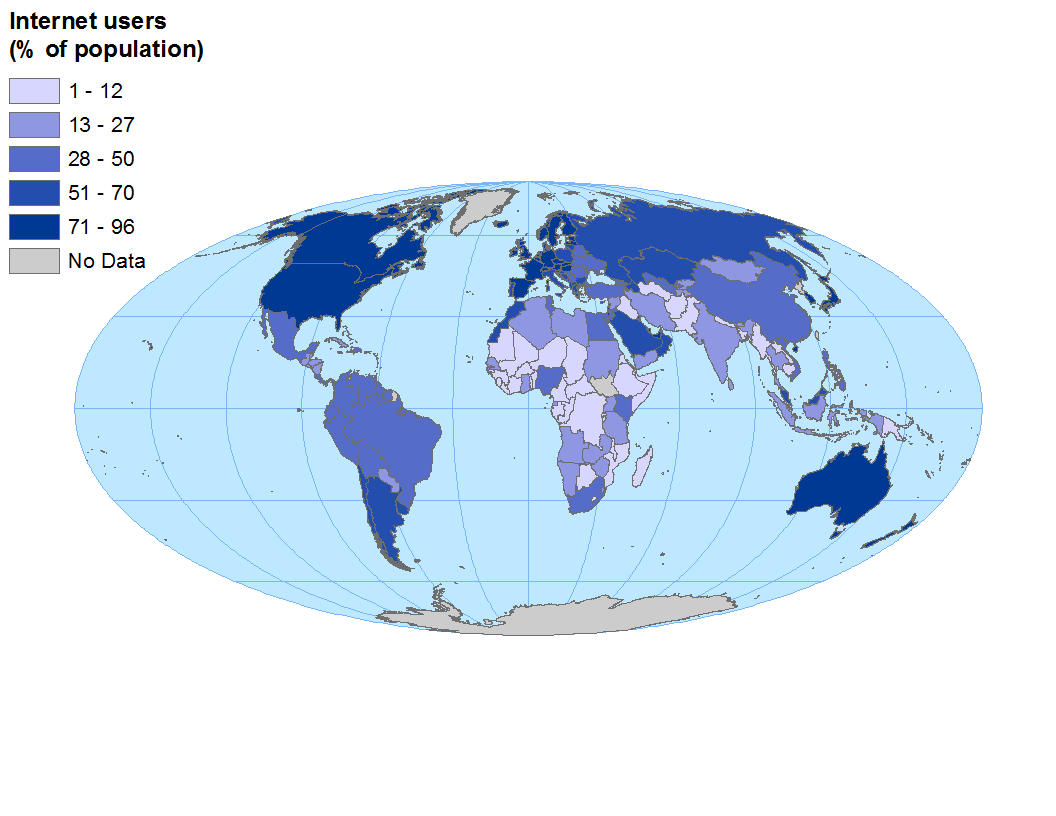
Internet users – % of population (click to enlarge)
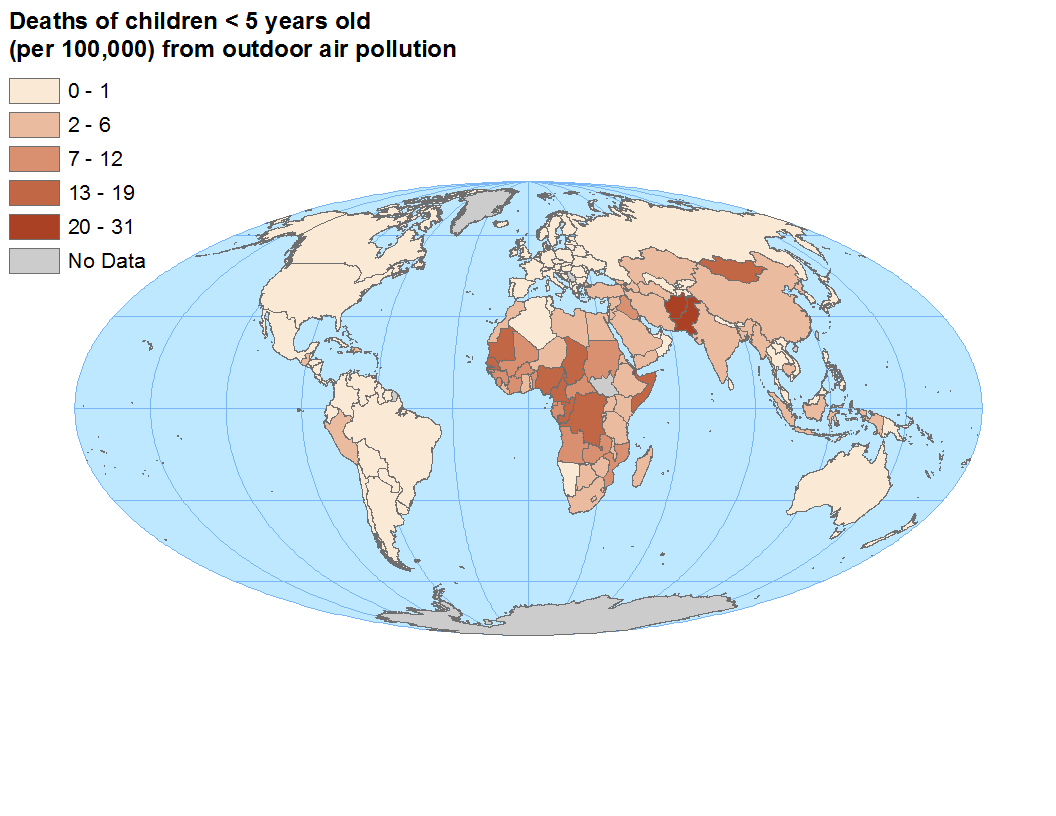
Deaths of children < 5 years old (per 100,000) from outdoor air pollution
The UNDP HDR provides information compiled by country, which indicates whether people are able to “be” and “do” desirable things in life, such as be well fed, sheltered, and healthy; have work, access to education, be able to vote, and participate in community life; have freedom of choice. Statistics obtained from or about each country, such as the number of deaths due to outdoor air pollution, the proportion of the population with access to the internet, the length of mandated maternity leave for new mothers, the proportion of the population below the national poverty line – provide indicators about the quality of life in these countries. Based on these indicator statistics, the UNDP also compiles a relative index called the Human Development Index, which can be used to compare the quality of life across countries.
Vassar students in Geog102 (Global Geography: People, Places, and Regions) work with the UNDP data as part of a GIS lab exercise, in which they learn how to add geographic data to a world map and examine the data. Pictured below are some examples of maps created with this data. The UNDP HDR 2014 data set contains information from 2014 and is more likely data collected over a span of several years. (The 2015 report will be released on December 14th.) Users of the data need to look at the attributes of the data and the original notes to determine these specifics.
Almost all of the data available from the 2014 Human Development Report has been compiled into GIS format. For more information about the data, you can download the full report and refer to pp. 155-158 (Reader’s Guide section). To obtain this data set, or if you have questions about this data set or other GIS data, see Neil Curri (necurri@vassar.edu, Ely Hall Rm. 102).
Human Development Index Rank (click to enlarge)