Mary Ann Cunningham (Geography)
Researchers seeking progress on climate policy have struggled to convince policy makers that a 2-4 °C change is meaningful. They have demonstrated serious vulnerability for agricultural production in developing regions. But influential policy makers in wealthy countries may find it more compelling to visualize climate impacts close to home and in the near future.
Dramatic changes in production are likely to be disruptive for growers and their communities, with ripple effects for larger economies, including educational institutions that rely on agribusiness funding. Recent approaches to mapping climate and food production in the US have included models of drought frequency, land cover change probability, models of changing food demand, and multivariate land capability modeling, and economic drivers, but few have yet published climate-based, mapped visualizations of production shifts in the US Midwest. I focus here on corn (Zea mays) because it is the main US crop by mass and value.
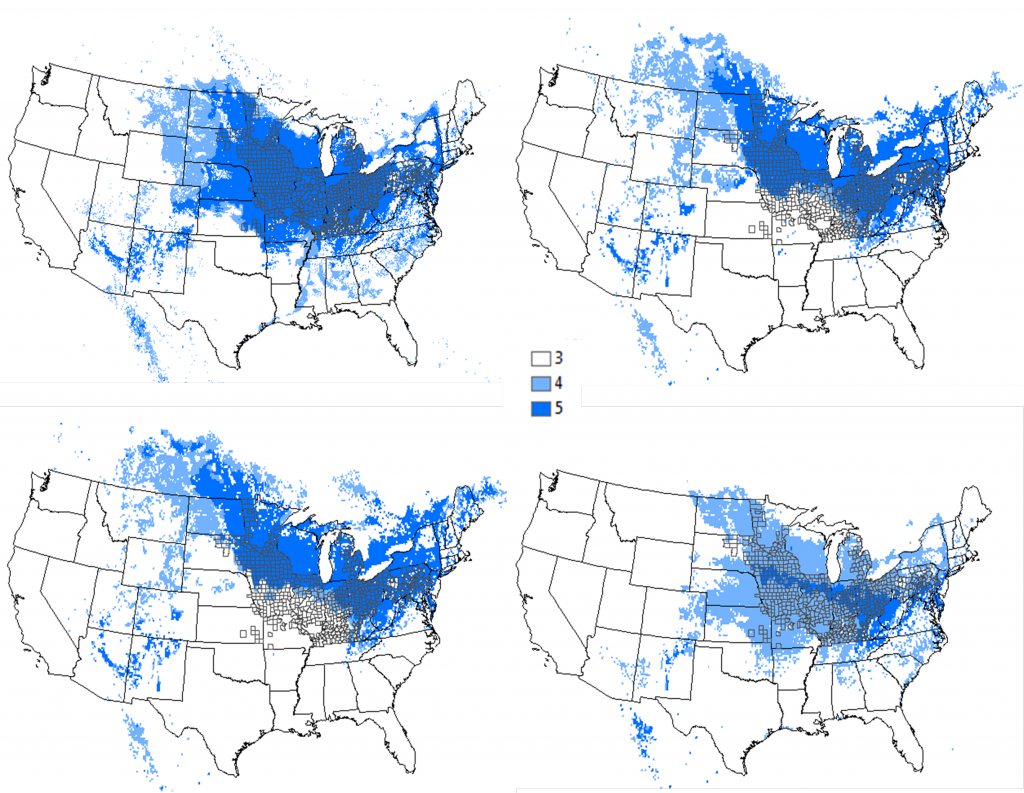
Results Suitable growing temperatures did not occur through the 3-month (JJA) growing season for most of the traditional corn belt region.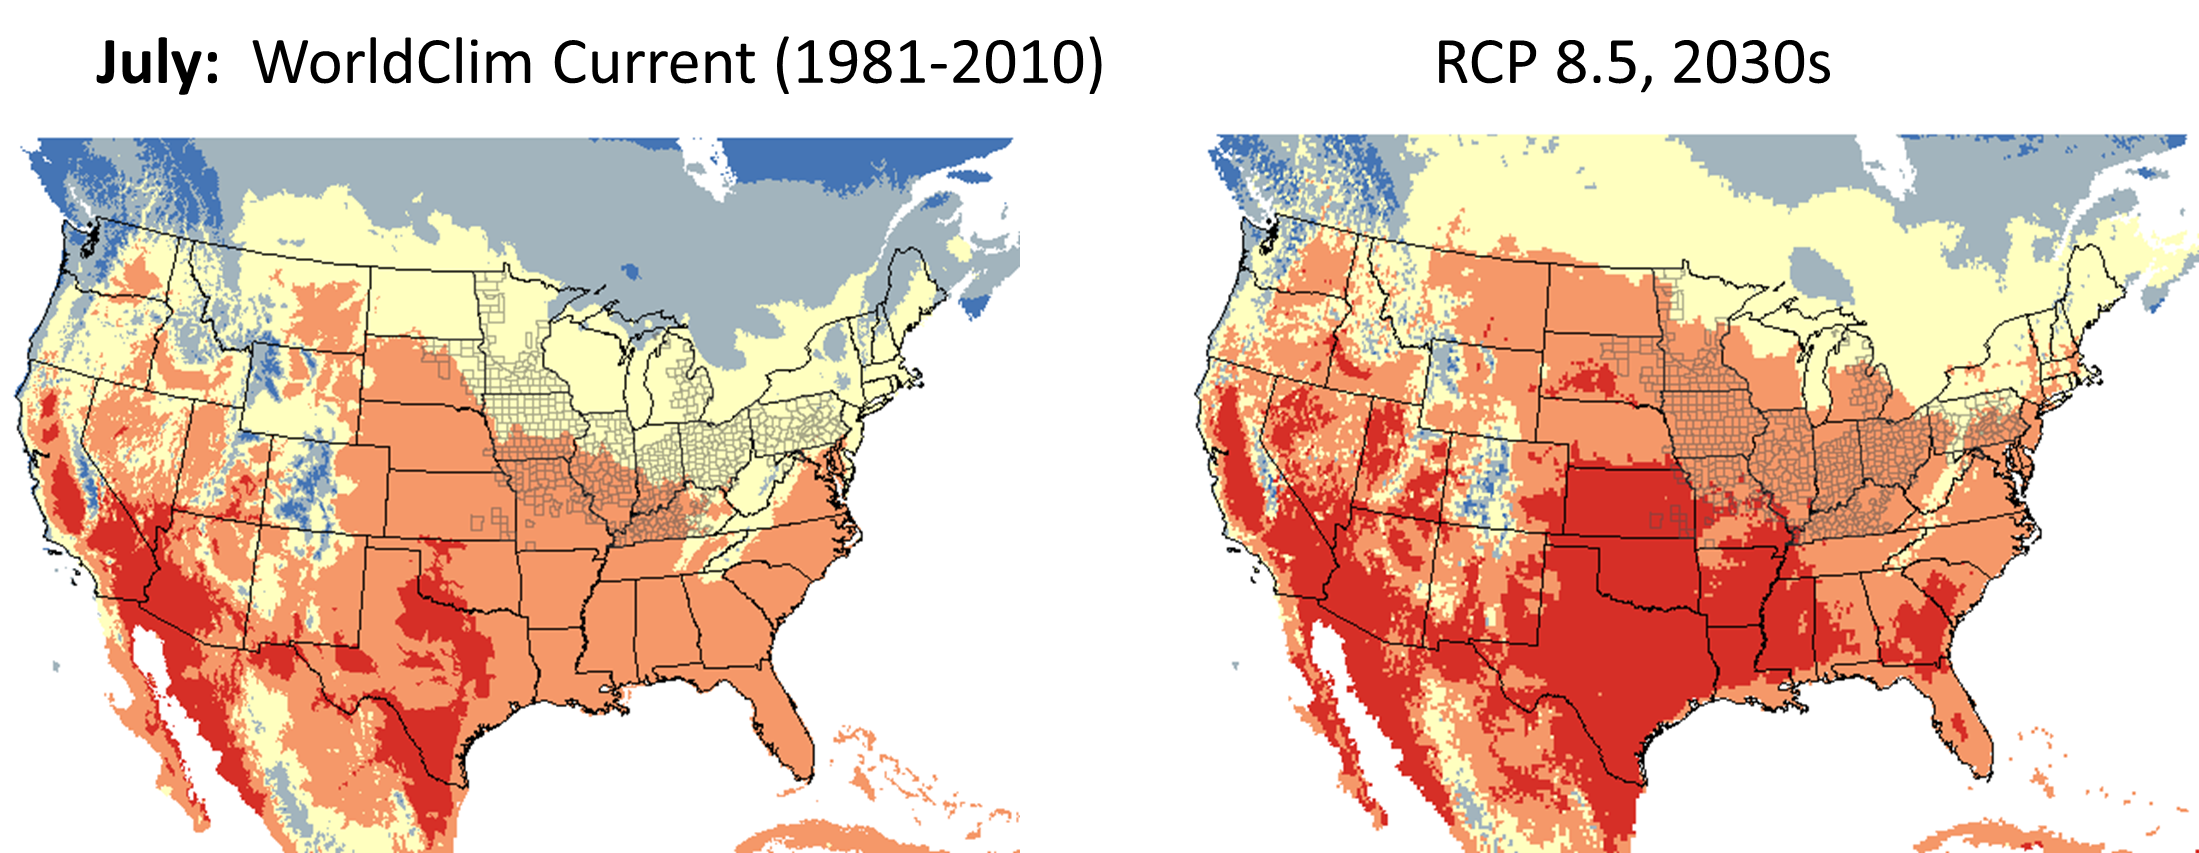
The distribution of suitable climate conditions decreased in area and moved north. Much of the current Corn Belt will be outside the tolerance range of this crop.
Results were similar for RCP 4.5 and RCP 8.5. For the MJJ model, suitable conditions were much narrower, evidently owing to shorter duration of cool spring before summer temperatures rise in June.