
Jasper Selwood ‘27
This summer, I worked with Professor Sarah Pearlman to research how immigrant inflows affect the immigration legislation that is subsequently passed at the state level. I started by reading academic articles on the history and future of immigration in the United States, and refamiliarized myself with the program Stata, which I already had some experience with through my econometrics coursework. I practiced making graphs and maps using IPUMS census data, which also allowed me to understand the strengths and limitations of this dataset.
Next I studied the existing literature surrounding our research question. A paper by Mayda, Peri, and Steingress showed a correlation between republican vote share at the federal level and the skill levels of immigrants. Specifically, inflows of lower skilled immigrants, meaning those with a high school education or below, led to an increase in republican vote share, while inflows of high skilled immigrants led to a decrease in that vote share. Professor Pearlman and I hypothesized that the same effect exists between immigrant inflows of different skill levels and state legislation. To answer this question, I looked at different legislative databases with different methods for tracking and categorizing bills. I created scatterplots which indeed showed a correlation between the skill levels of immigrant inflows into each state and the inclusiveness or exclusiveness of the legislation those states passed. While not conclusive, the scatterplots showed that inflows of lower skilled immigrants were correlated with more restrictive legislation, while inflows of high skilled immigrants were correlated with more inclusive legislation.
The questions of what legislation to include, where to draw the lines between inclusive, neutral, and exclusive legislation, and how to score the scope of each bill proved to be some of the biggest challenges of my research. To give a concrete example: In 2016, Maine’s state legislature passed a bill raising crossbow fees by one dollar for non-citizens. How can this extremely narrow restriction be compared to laws like a 2011 omnibus bill passed in Indiana which bars undocumented immigrants from public benefits, heavily restricts their ability to be employed, and creates new crimes for harboring them? These examples give a sense of the massive variety of immigration legislation passed at the state level and the challenges of categorizing them.
Eventually Professor Pearlman and I decided the existing databases of legislation were inadequate, either because of flawed methodology or because they were too outdated. Since manually coding every bill wasn’t feasible with our timeframe, we decided to have the AI program Claude categorize every bill passed at the state level between 2009-2023 (4404 bills). I drafted a detailed prompt and directed Claude to code them as either inclusive, exclusive, or neutral. I also had it add a scope, other 0 (symbolic), 1 (minor impact), or 2 (major impact). After that I manually checked and corrected half of the bills. It became clear by the end that my prompt left open grey areas which Claude did not code consistently. I think that with a more refined prompt covering more of the many edge cases, it would perform more consistently. I created scatterplots from my constructed dataset, which differed slightly from the scatterplots I created previously, however the general trends remained the same.
This summer ended up being a great opportunity to both design and code my own dataset as well as work with existing datasets. I saw my data analysis skills improve significantly, and made real progress towards answering a research question I find genuinely fascinating. I’m excited to present my work at the Symposium and hopefully see the research pushed forward in the future.
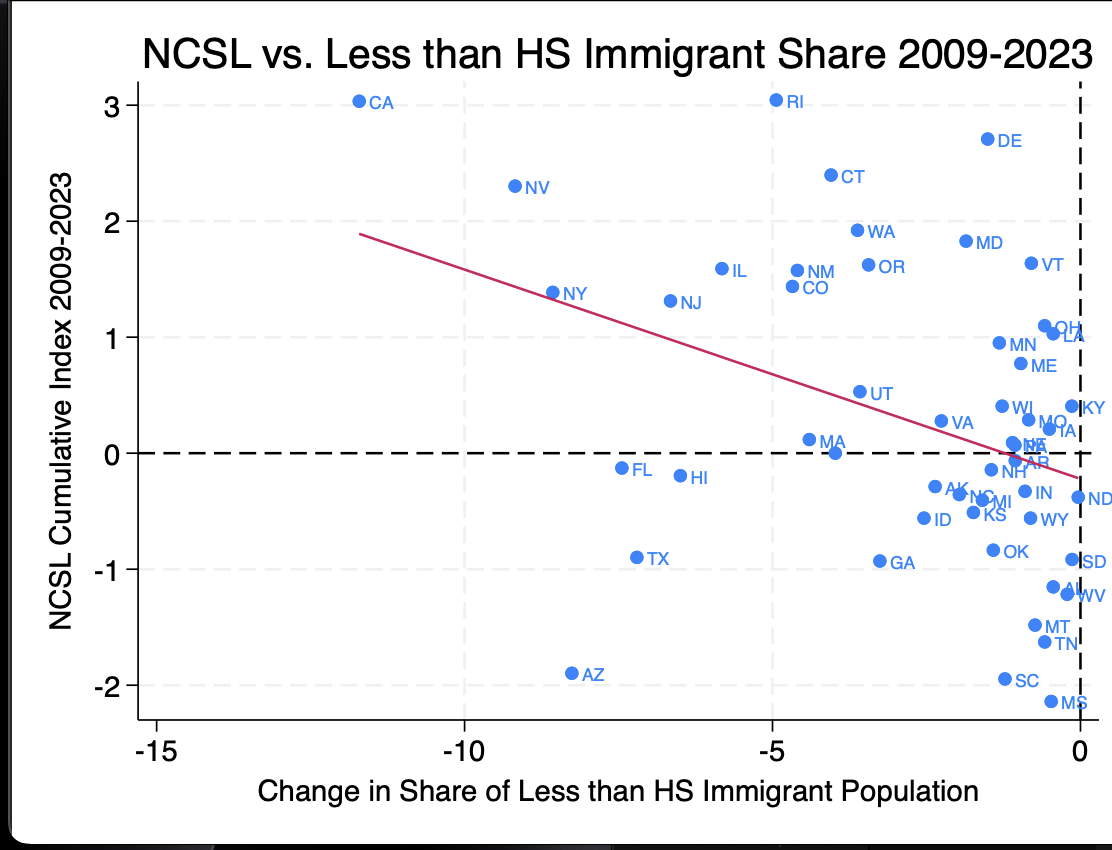
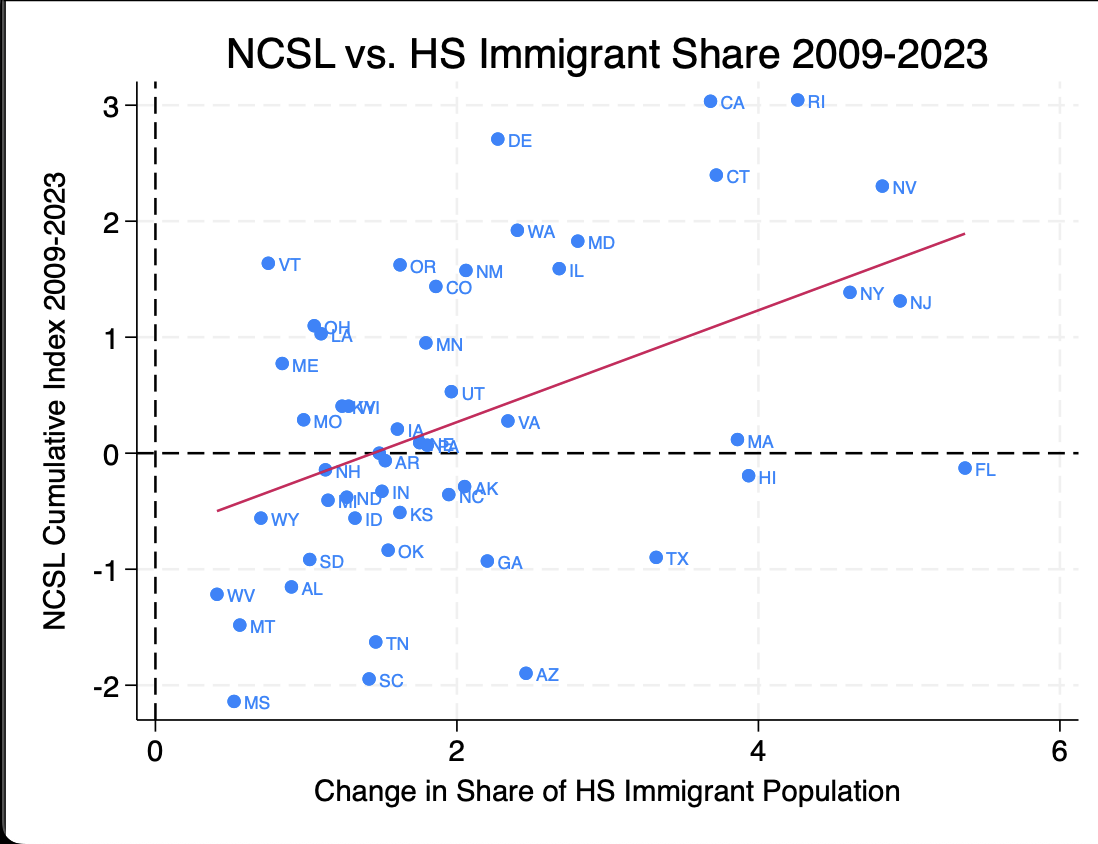
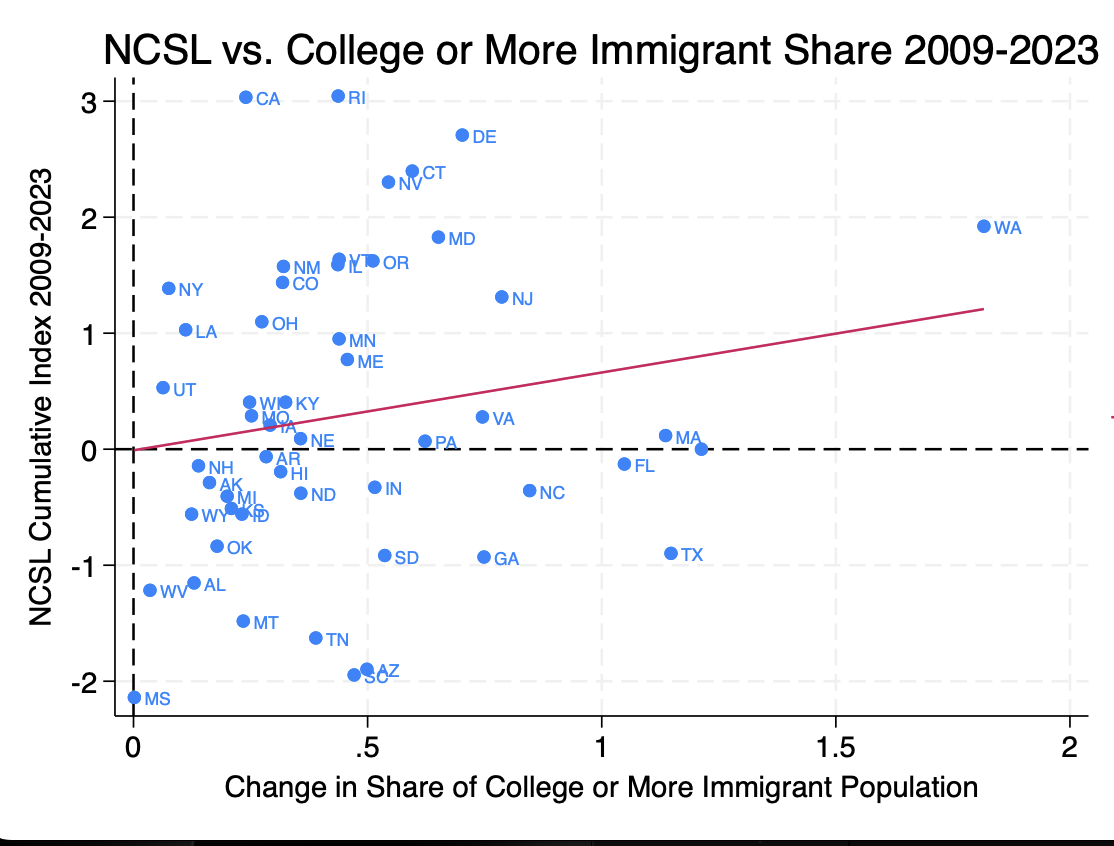
(Positive Y axis is more inclusive legislation, negative Y axis is more exclusive)
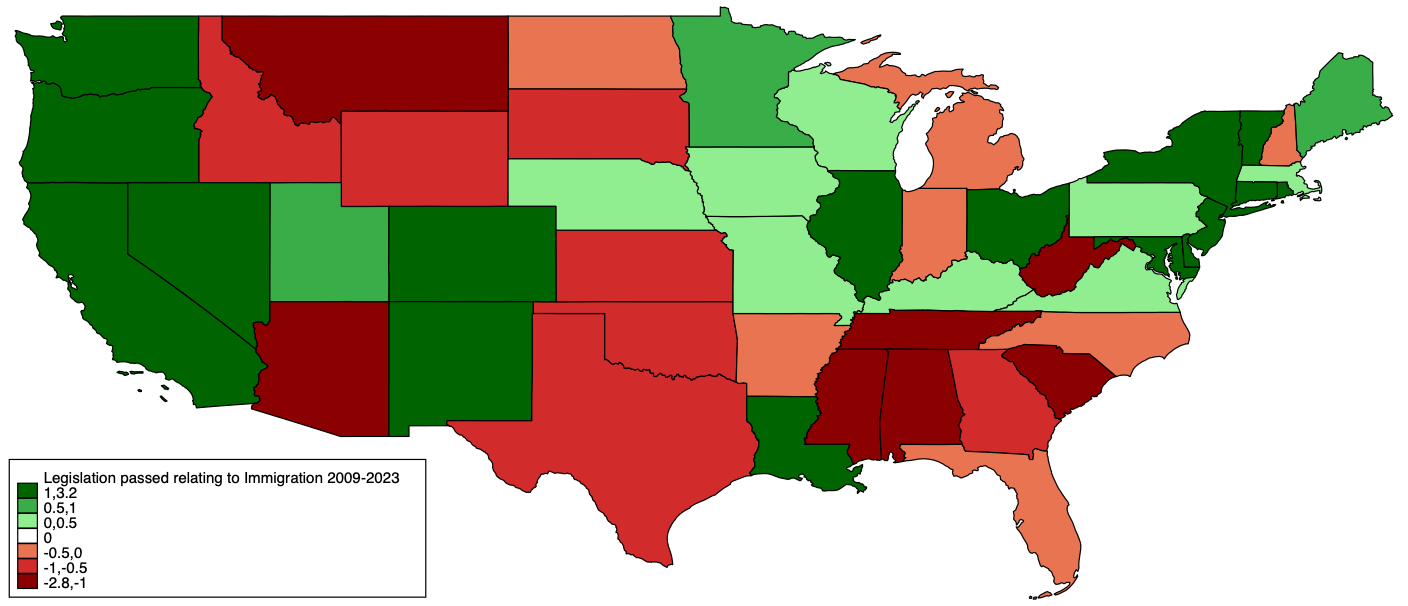
(Red is more restrictive, green is more inclusive)