In the endlessly diverting media game of finding the next Brooklyn, the Hudson River Valley gets referenced a lot. I suppose there’s good reason, since it’s not so much that this region rivals the urban upgrading and cultural attention associated with the New York City borough some 100 miles to the south, but that the Hudson Valley could feasibly draw actual residents of Brooklyn itself. As the cost of living and demand for services go up in Brooklyn, why shouldn’t Brooklyners depart for more roomier settings of small-town brick and backyard gardens?
Or so the New York Times asked back in 2011 in an article called “Williamsburg on the Hudson.” At the time I looked at some population data for Brooklyn and the Hudson Valley and responded that most residential changes occurring here weren’t stemming from the relocation of young hipsters of the kind depicted in HBO’s Girls and so on. Instead, the primary source of population change came from older households, many of them “empty nesters,” who were snapping up residential and vacation-home real estate in smaller towns and rural settings.
It’s been almost four years since then, and admittedly a lot has happened in the Hudson Valley. The city of Hudson (in Columbia County) has basked in a new bohemian cachet, epitomized by the Basilica Soundscape music festival and the relocation of downtown Manhattan artists, to complement its rather bourgeois antique district. The city of Kingston (in Ulster County) appears to be following suit, with an uptown district stocked with nightclubs, record stores and coffeeshops drawing a new and visibly young (25-34 years old) clientele. Smaller hamlets in the Catskills and elsewhere have cultivated buzz with trendy B&Bs and the odd attraction (like Roxbury’s Eight Track Museum). And the transformation of Beacon via art galleries and studios has continued unabated.
So what’s the latest picture? Have the so-called Millennials really joined the Gen-Xers and baby boomers in the pursuit of Hudson Valley lifestyle and location? Local elected officials and real estate agencies will tell you they have, but what do the data suggest?
Below, I’ve updated the 2000-10 statistics I used in my 2011 post to include some more recent figures from the U.S. Census Bureau on Brooklyn and Hudson Valley population trends. I’ve also availed myself once again of the new Census Flows Mapper data to see if there’s a discernible stream of Brooklyn migrants in the Hudson Valley. Let’s look at some tables.
Population changes in Brooklyn and the Hudson Valley
Tables 1-9 report data on population changes in Brooklyn and the six-county Hudson Valley region. Also shown for comparison: New York City and New York state population.
Three data points are shown: 2000, 2010, 2013. The first two come from the decennial Census survey — the figures I used back in my 2011 post, and still the most reliable measure of population trends. 2013 data is estimated from five years, 2009-13, of samples from the annual American Community Survey. That means these figures don’t represent 2013 exclusively, but nonetheless they indicate changes that have registered after the last official Census (2010) and since the 2007 recession lessened. They also contain notable margins of error (not shown here) for smaller populations, such as individual Hudson Valley counties; thus, narrow differences in 2013 figures should be treated with caution.
The first five tables report absolute values, which correspond to the raw figures on population gains (the recent story of Brooklyn and New York City) and losses (the historic trend for upstate and New York state on the whole). I begin by looking at the general population trends for the places in question.
Population growth can be seen across almost all areas for the entire period, including the state as a whole. In the Hudson Valley, only Columbia County saw population loss over the period.
However, a closer look reveals that the last three years show population losses or anemic growth throughout the Hudson Valley — possibly an indication of post-recessionary cool-down of residential migration. The most robust recent growth in the Hudson Valley was found in Orange County, a bedroom commuter county off the I-84 and the largest of the six Hudson Valley counties. By contrast, Brooklyn and NYC show healthy and steady growth. Even in the past three years, the city’s population growth accounts for 86% of the entire state’s growth.
Now let’s look at the size of specific cohorts — specifically, the different kinds of age groups that might drive so-called Brooklynization.
The 20-24 age bracket roughly corresponds to the years for college and early grad/professional school for those seeking education. College and grad students may pursue a level of long-distance geographical mobility that extend beyond the “natural” rate when individuals begin to pursue work and household formation in earnest.
This cohort shows steady growth across all the areas, although these figures mask different magnitudes of population. For example, fast-moving Columbia County (where Hudson is the county seat) added about 800 20-24 years olds to an area of 648 square miles over the course of 13 years, while slow-moving New York City added some 47,000.
Note that Brooklyn lost some 200 people in this age bracket since the 2010 Census. Although very small, this is the only 2010-13 decline for any of the areas reported here — possibly a sign of residential saturation (i.e., overpricing) for this age group.
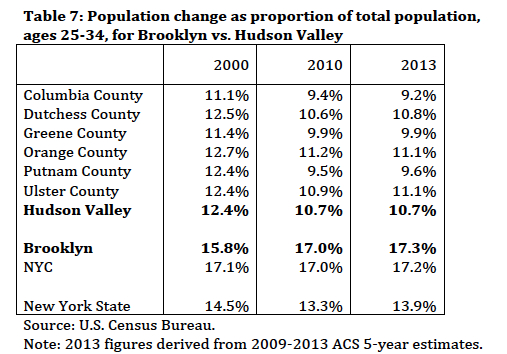
Demographers view the 25-34 life stage as a traditional period of family formation. Increasingly, highly educated people postpone family formation in these years, if they don’t reject it altogether. Perhaps relatedly, these are the stereotypical “hipster” years.
All six counties of the Hudson Valley lost people in this bracket over the 13 years reported here, although Dutchess County (which includes Beacon), Ulster County (which includes Kingston, New Paltz and Woodstock), and exurban Putnam County have started to get them back since 2010. The same holds for the state of New York as a whole.
By contrast, Brooklyn and NYC registered positive growth in this cohort. Brooklyn especially outpaces the larger city in growth of 25-34 year olds — something we won’t see for any of the other age brackets here.
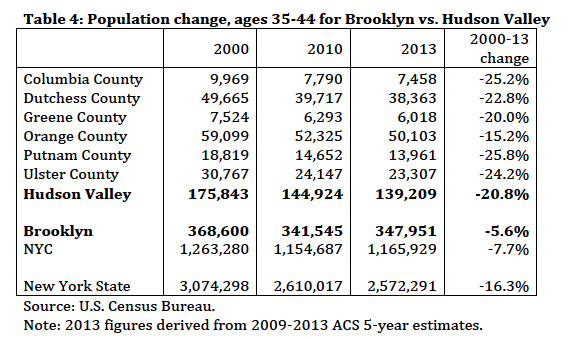
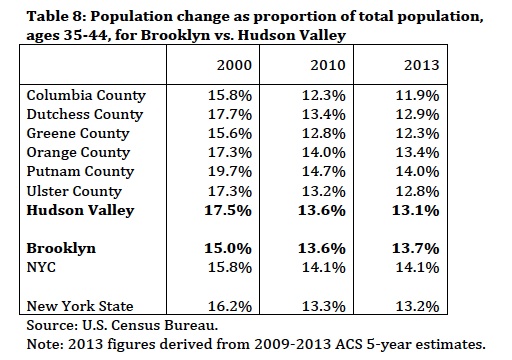
The 35-44 age bracket are key years of family formation for those inclined to have families. Traditionally, economists regard these years as the period when households are most sensitive to costs of living and income-earning opportunities — two historic liabilities of the “rustbelt” state of New York.
All the areas reported here lost residents ages 35-44, from tiny Greene County to New York City to the state as a whole. Ideally, we would want to track population change of childhood cohorts to get a better sense of whether the 35-44 year olds have left for more affordable “family friendly” destinations.
Note that the population drops in this age bracket are the smallest in Brooklyn and NYC, at least as a function of percent change. Perhaps more importantly, these places have started gaining this group back since 2010.
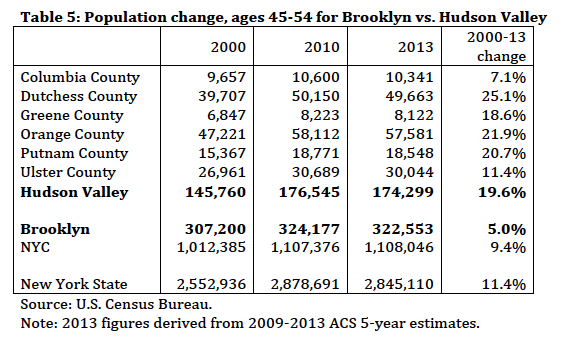
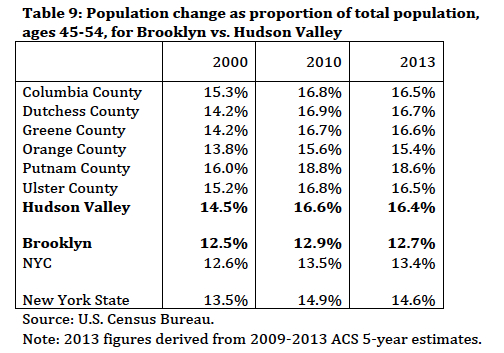
Ages 45-54 are years when many families are in the thick ofchild-rearing and/or transitioning into “empty nests” when children graduate from high school. They also tend to be peak income-earning years for many.
All the areas reported here show positive growth in this age bracket, even if these net gains hide post-2010 declines for all areas but NYC. The Hudson Valley’s gains here are fairly robust — a chief takeaway from my 2011 post — but note that the biggest increases registered in its southern counties closest to NYC — possible evidence of these places’ growth as bedroom commuter settings.
The next four tables present the same data differently, reporting population figures as a proportion of total population (as taken from Table 1). This statistic indicates the comparative size of different cohorts within the population. Especially as particular areas lose population on the whole, growth in the proportion of particular age brackets suggest how places become “younger” or “older.”
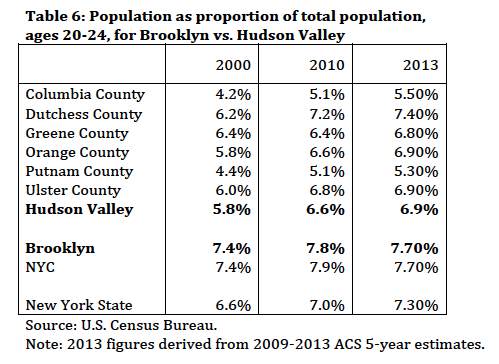
All the areas shown here have expanded the size of their 20-24 cohort since the millenium — possibly because this age group has been more reluctant to leave the state for college or work. A between-decade snapshot, which we don’t have, could give a better sense of how much this trend can be attributed to the 2007 recession.
Within the state, NYC is younger (i.e., has more college-age kids) than the Hudson Valley or the state as a whole. Within the Hudson Valley, Dutchess and Ulster County have the largest 20-24 cohort, almost certainly because of their colleges.
Maybe more than any tables, this one demonstrates the “Brooklyn effect”: since the millenium, the 25-34 cohort has grown as a proportion of the total population in the borough. In fact, for all the age brackets examined in these tables, only Brooklyn and NYC as a whole count the 25-34 cohort as their largest cohort — a stark contrast to this cohort’s smaller numbers and declining proportions in the Hudson Valley.
Within the Hudson Valley, this cohort decline has slowed or, in the case of Dutchess and Ulster County, modestly reversed in the last few years.
Amidst Brooklyn’s population shifts, some age group had to lose relative importance, which we see here: the proportional significance of the 35-44 cohort has decreased in the borough and NYC as a whole since the millenium. But that’s true for all the areas examined here. In fact, the Hudson Valley began the millenium with this age bracket occupying bigger proportions than their Brooklyn counterparts, and now the situation has reversed. Note that Brooklyn’s cohort shows recent signs of reversing the proportional decline of this age group.
Brooklyn’s 45-54 age cohort has stayed relatively flat since the millenium — a notable contrast to the cohort’s growing prominence in the rest of NYC, the Hudson Valley and the state as a whole. A break down (not shown here) of the constituent cohorts in this age bracket shows that 50-54 year olds are proportionally larger in the Hudson Valley than are any other cohorts I’ve tracked. These upstate patterns are more consistent with the state’s “rustbelt” reputation, although we’ll see that a fraction of this is driven by Brooklyn relocation.
Migration between Brooklyn and the Hudson Valley
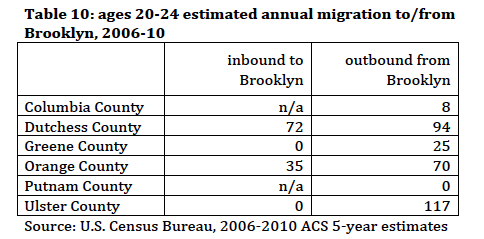
These last four tables report the U.S. Census Bureau’s estimates of annual migration to and from Brooklyn and the six Hudson Valley counties. The Brooklynization thesis emphasizes what, below, I call “outbound” migration from Brooklyn to the Hudson Valley. Still, it’s worth looking at the reverse flow — “inbound” migration from the Hudson Valley to Brooklyn — to get a sense of how net migration between these two regions shakes down.
The figures are derived from five years, 2006-10, of samples from the American Community Survey — not the same five years represented by the “2013” column in Tables 1-5, and furthermore a period that overlaps the 2007 recession that possibly inhibited long-distance residential migration. So, consider these somewhat conservative figures, and remember they estimate just one year’s worth of residential migration.
[Methodological note: the U.S. Census Bureau’s Census Flows Mapper doesn’t make inbound migration to Brooklyn (Kings County, New York) available for Greene and Putnam Counties because of various disclosure avoidance measures applied to the ACS dataset and the county-to-county migration estimates in order to avoid identifying individuals. Given this incomplete dataset, I decided not to report net migration figures for each county and the aggregate Hudson Valley.]
All the Hudson Valley counties but Putnam receive Brooklyn 20-24 year olds; by contrast, only the two most populous counties (Orange and Dutchess) send their 20-24 year olds to Brooklyn. It’s possible most of this migration reflects college mobility. Seasonal work in the Hudson Valley’s recreational and tourism sectors may draw young Brooklyners as well, as suggested by those 25 migrants to Greene County (with its ski slopes).
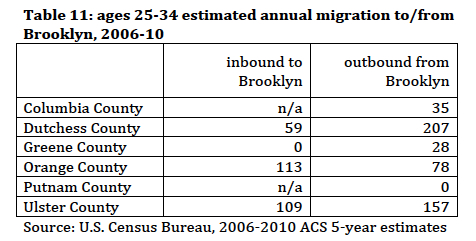
Migration reaches its greatest levels with the 25-34 year old bracket shown here. Of course, that’s generally the norm for individuals in this important life stage of career launch and romantic/household formation.
Recall from Tables 3 and 7 that the Hudson Valley lost residents in this age group. Nonetheless it still gained new residents within that net loss, and this table indicates it gained more from Brooklyn then it sent there. Dutchess and Ulster Counties leap ahead of the other Hudson Valley counties as residential destinations.
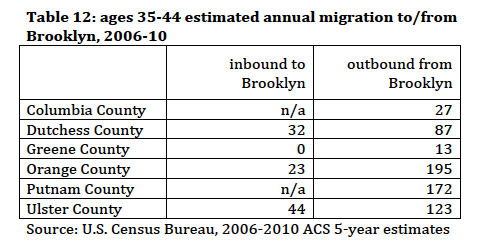
Recall from Tables 4 and 8 that all areas — Hudson Valley counties, Brooklyn, NYC, and the state as a whole — lost population in the 35-44 age bracket. At least from Brooklyners in this cohort, one popular destination is the Hudson Valley. In fact, more Brooklyners move to the Hudson Valley at ages 35-44 than at any other bracket reported in Tables 10-13.
For this age group, the pattern of residential relocation follows commuter proximity to the NYC metropolis; Orange and Putnam Counties are the top destinations, while Ulster County continues to remain popular.
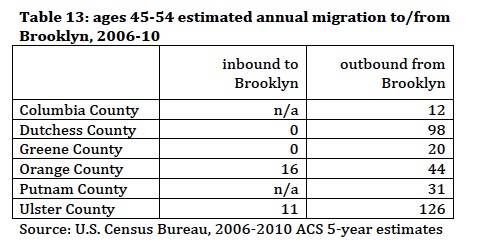
Recall from Tables 5 and 9 that the Hudson Valley, NYC as a whole, and the state gained population ages 45-54. Within that pattern, we see here how Brooklyn has driven that process. To a large degree, this has happened because Hudson Valley migration to Brooklyn has almost ceased. Thus, whereas the number of Brooklyners ages 45-54 moving to the Hudson Valley is almost half the number of the previous (35-54) cohort, the ratio of outbound to inbound migration is at its greatest level of skew (more than 10 to 1) toward outbound migration to the Hudson Valley.
The southernmost commuter counties of Putnam and Orange are no longer primary destinations. The highest ranking county, Ulster County draws practically the same number of 45-54 year olds from Brooklyn as it has for all three prior cohorts — a contrast to the variable flows of different Brooklyn cohorts received by the other Hudson Valley counties.
Conclusion
Amid the typical exodus of 25-34 year olds from the Hudson Valley and upstate New York, there appears to be a small counterstream of 25-34 year olds moving from Brooklyn to the Hudson Valley. They help explain the most recent (2010-13) reversal of this cohort’s diminishment in Dutchess, Ulster and Putnam County. Still, their visiblility and celebration (hype) notwithstanding, this stereotypical hipster demographic doesn’t outweigh the larger stream of 35-44 and 45-54 year olds moving from Brooklyn to the Hudson Valley. Thus, even as we note the arrival of Millennials (while trying to avoid the local hype surrounding them), I remain persuaded by the chief takeaway of my 2011 post, that the “Brooklynization of the Hudson Valley” generally remains driven by middle-aged migrants.
We should also acknowledge that the Hudson Valley is a diverse region. For one reason, parts of the valley take in other, more conventionally “exurban” forms of residential migration from Brooklyn and New York City as a whole. I’m refer here to Orange and Putnam Counties to the south, which are still the main destination for 35-44 year old Brooklyners. Not that these newcomers can’t enjoy some local farm-to-table dining and agriculture, but their residential choice remains structured by the commuter lifestyle.
More generally,, individual counties may gain population in some places and lose population in others, all of which gets lost in the county-wide figures I report here. I’d especially like to see a place breakdown for Dutchess County (with trendy Beacon surrounded by fairly well-to-do technoburbs in the south) and Columbia County (where Hudson may be the lifeline keeping the rest of the fairly rural county afloat, demographically speaking). A place-by-place breakdown was beyond the scope of my little data-gathering exercise here, and so far it’s not available for the new population flows data provided by the Census Bureau, but it remains the frontier for this kind of analysis.
That said, especially intriguing is the robust draw of Ulster County for all the age cohorts I looked at. More than any other Hudson Valley county, it draws steady streams of migrants at all stages of income-earning life. With the state university in New Paltz, the celebrated small towns of Woodstock and Rosendale, the trendy Kingston, and of course its crucial intersection by I-87 up from the city, Ulster County appears to be a ‘place for all seasons.’

