Author Archives: rpanek

Visual Representation of the Long-Run Impact of the Measles Vaccine in Mexico

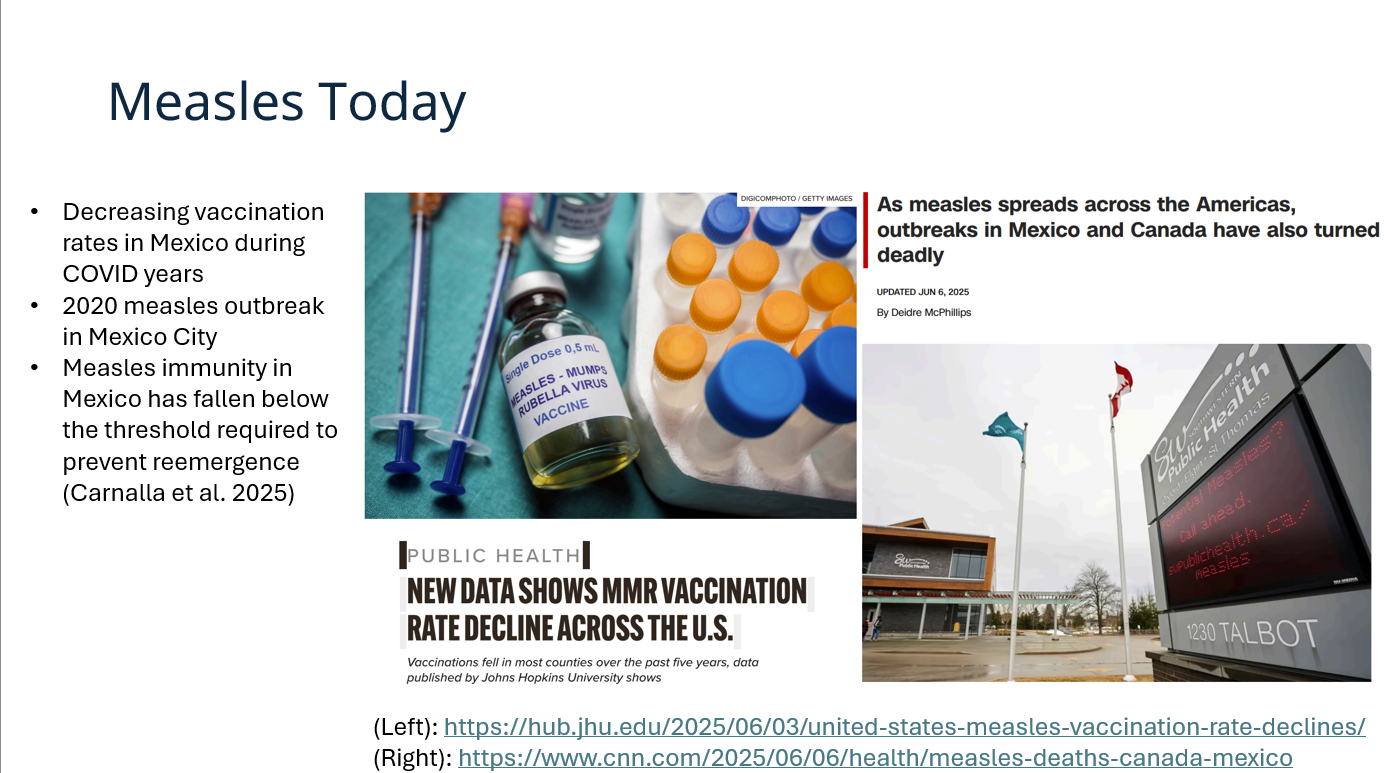
This summer, I worked with Professor Alicia Atwood to study the long-run impacts of the measles vaccine in Mexico and explore the best ways to accessibly communicate health and economic data to broad audiences. Prior economic research has linked the measles vaccine to positive effects on schooling, employment, and income. As measles threatens its return across North America, this project presents a timely reminder of the importance of vaccination against measles. Our time was split between researching and modeling the effects of measles in Mexico and researching and implementing evidence-based approaches to data visualization.

The first half of our work began with reviewing relevant economic and health literature. From these sources and further historical documentation, we collected information to gain a clearer understanding of measles in Mexico, both before and after the introduction of the vaccine. We used these pivotal steps to inform our decisions regarding data and modeling. With strong justification, we carefully cleaned and prepared our 50 million observation dataset. Although these steps were time-consuming, they were fruitful. Once we were able to apply our model, we found significant effects on education, employment, and relationship status, all of which were consistent with previous literature.

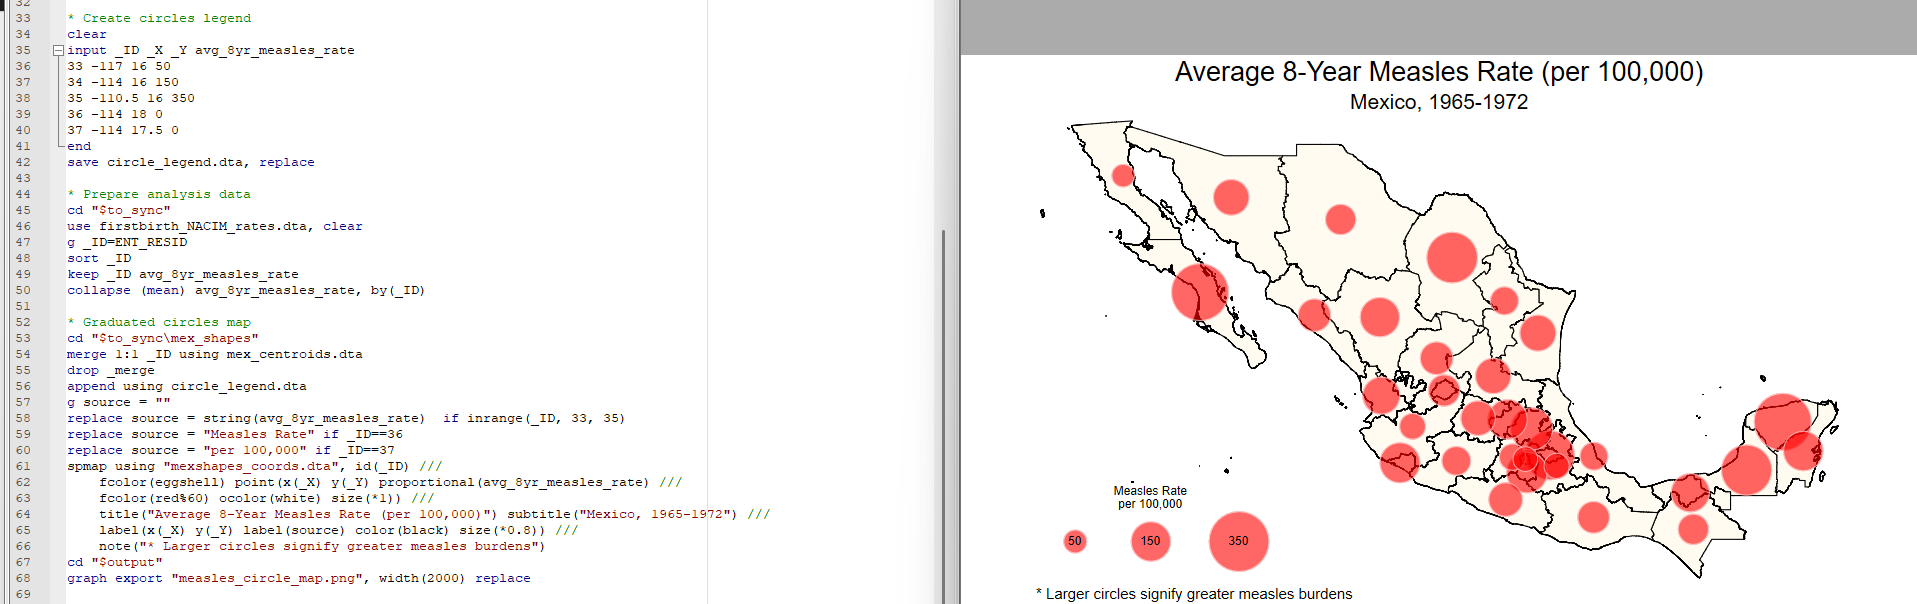
With a strong set of results established, we asked a difficult question: how can visuals help synthesize dense information into a digestible message for a broad audience? We began by revisiting previous economic and health publications to look for particularly effective and creative visuals. Then, we explored across psychology, sociology, and other sciences for visualization best practices–what graphs are most effective, which colors best tell our story, and what’s the right amount of detail for a chart. Afterwards, I spent a lot of time learning new and complex coding techniques and applying our new visualization toolkit to our data.

My time working on this project was incredibly rewarding. In an increasingly vaccine-hesitant world, I had the opportunity to contribute to the struggle against vaccine misinformation, all while improving as a researcher under Professor Atwood’s guidance. I learned so much while studying how to effectively communicate our work through visuals. Our project forced me to draw a connection between our work in an academic setting and the valuable information it has to offer the general public. For me, this unique experience drove home the crucial humanistic aspect of social science research.

Impact of the Measles Vaccine on Morbidity and Mortality

Maggie Greenberg, Ryan Panek

This summer we worked with Professor Atwood to examine the educational impact of the measles vaccine in Texas. Professor Atwood has previously studied the impact of the measles vaccine on employment and earnings in the U.S. in her 2022 paper. Professor Atwood and Professor Pearlman worked together on examining the impact of the measles vaccine on both schooling and labor market outcomes in Mexico in their paper from May 2024. Through our research this summer we seek to fill a missing link in her research by showing how the measles vaccine affects schooling in the U.S.

Our focus this summer is on Texas because it has a large amount of data available both on disease and education. Additionally, Texas being such a populous state is ideal because we have a wide range of counties, from very urban to very rural, that allows us to exploit variation in incidence rates of disease and population densities. We read through the medical literature on measles and found that it proves to be a unique disease to study because it is universal and causes “immune amnesia”. Universal means practically everyone will contract it at some point in their childhoods before the vaccine introduction. Immune amnesia means that when children contract measles not only do they get sick but their bodies lose the antibodies to other infectious diseases which then take about three to five years to rebuild. Therefore, once children have measles they are more likely to get sicker throughout their childhoods, which we would hypothesize has an impact on educational attainment. 

Our work has included manually entering the data for the disease counts for a myriad of illnesses in every county in Texas from 1951 to 1977, as well as the attendance and related education data for the individual school districts from 1960 to 1971. We used Stata software to clean our data and run descriptive statistics. We also created maps and figures that highlighted case counts over time. Initially, we expected measles cases to experience an immediate drop-off when the vaccine was licensed but our data showed that a drop-off did not occur until a few years after the licensing. From there we worked on piecing together a puzzle of the history of the Texas vaccine rollout to figure out why this is. We sorted through hundreds of newspaper clippings, TV broadcast scripts, video footage, medical journals, and more to learn about who had access to the vaccine and when. 

With all the information we have gathered this summer, we plan on writing an article about the measles vaccine rollout in Texas. Meanwhile, having uncovered Texas’ complicated vaccination timeline, we are working towards a clearer picture of before and after periods so that we can run event studies and continue our statistical analysis. We hope our research can add to a story not just about the importance of vaccines but also about the need for large-scale federal policy to ensure the implementation of immunization efforts and healthcare as a whole.