Our experiment focused on the auditory illusions known as the McGurk Effect. The McGurk effect shows that visual cues can affect what a person hears. This is shown when mouth pronunciations in a video can affect what a person hears. Even when the audio only plays “ba, ba, ba”, if the mouth pronounces “fa”, the person will hear “fa, fa, fa”. In cognitive science we can use certain brain waves as markers for certain activities in the brain. We wanted to see if explaining the McGurk effect to participants would affect the brain wave component known as Mismatch Negativity (MMN). The MMN is found in the 100-400 millisecond range after stimuli is shown. When it appears, this component shows that the brain registered the mouth was pronouncing a different word than the sound playing- in other words, it was not fooled by the illusion.
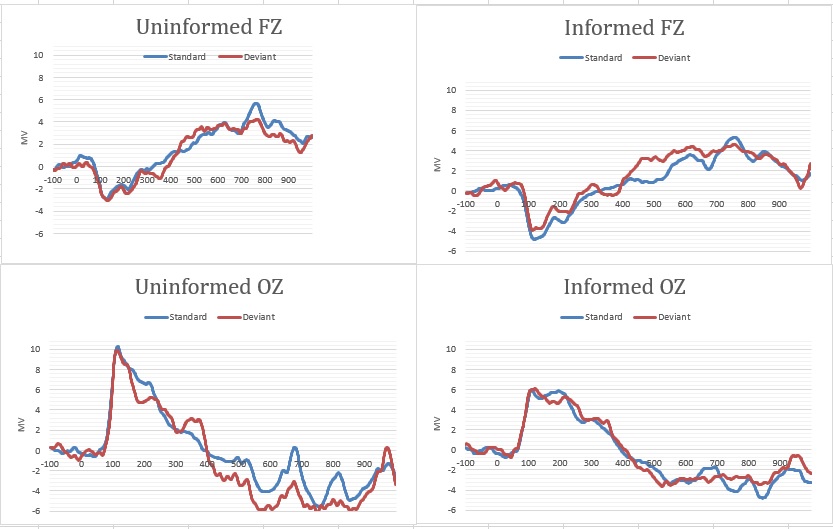
We averaged the brainwaves found in two specific electrodes- FZ and OZ. The FZ electrode is found in the frontal lobe of the brain, which is where we would expect the MMN to show. The OZ electrode is in the occipital (back) of the head, which is where we should not see an MMN. No MMN was found in the OZ electrode area, as expected. We found that individuals who were not informed about the illusion did not have an MMN wavelength (top left graph), while individuals that did get it explained did show the MMN (top right graph). This is interesting because although all participants reported experiencing the illusion, those who were explained the illusion had, on an unconscious level, not been fooled by the illusion. Their brain noticed the difference.