This summer, I worked with Professor Dustin Frye on the topic of spatial income inequality in the United States from the 1950’s onwards. Our main goal was to develop a comprehensive data set regarding the topic.
To achieve this goal, we used the County Business Patterns (CBP). CBP is run by the US Census, and is an annual series that provides subnational economic data by industry. This series includes the number of establishments, employment during the week of March 12, first quarter payroll, and annual payroll. We have access to CBP data all the way back to 1953. Within this data, we were interested in the county level data: county by county, industry by industry, how many people worked in that industry, what they were paid, and what the firm size breakdown was for that industry. The CBP data is in a digital form from 1970 onwards, but before then all we have are PDFs of the original books themselves, which isn’t very useful for economic analysis.
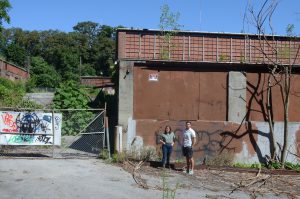
To make the pre-1970 data into a useable form, we used an OCR scanner to run an initial sweep of each year’s book. Each year has several thousand pages worth of data, so this step was crucial, as hand entering was not an option. After the data was read by the OCR scanner, we used excel and STATA to format it and write code that would find errors within the data from the scan. We also found more errors by scanning two different versions of each year. From there, we hand collected what was missed from the scan, and combined all of our data into one set, allowing us to examine income patterns from 1953 to the present day. Using this data, we looked then specifically at Dutchess County and explored local changes in industries and income. Since the 1950’s, Dutchess County has undergone an enormous shift, moving away from being a town with the majority of jobs in the manufacturing industry, and towards a more service-based
job market. We were able to visit old manufacturing sites as well to help investigate this change further.

