The first week in the lab mostly just involved getting acquainted with the equipment since no worms were available. I watched a laser safety video online so I could properly handle the lasers. They are all fairly safe, although goggles should be worn when using the blue laser to protect against eye damage. Goggles are not needed when handling the Helium-Neon red laser. The table was already set-up by the time I joined the team, but Bryan explained the arrangement to me. A pinhole, beam-splitter, mirrors, optical chopper, and slide holder are used. The table was setup so either laser could be used without having to move it each time. Bryan told me get acquainted with the lasers and Picoscope software by placing small objects, such as strands of hair, in a slide and shining the laser through it. He also showed me how to use the Picoscope software to record data. I practiced this a few times. I also researched the project we were working on by reading about diffraction patterns, Professor Magnes’ research, and by reading the project blog.
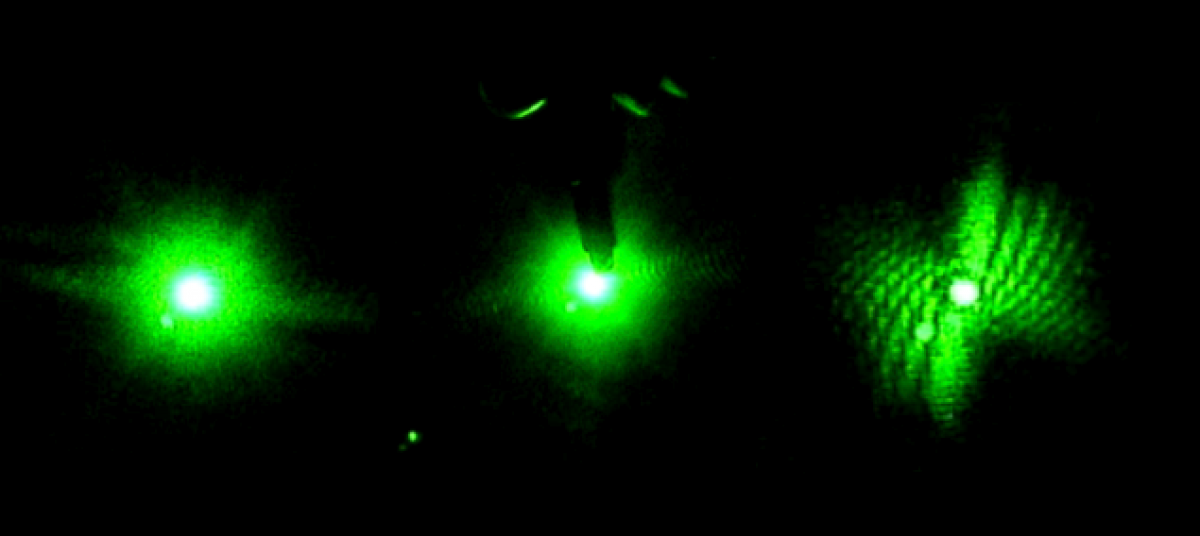
Later on, I got to work with live worms. Bryan showed me how to take one from a petri dish using a microscope, suspend it in a cuvette filled with water, and record data by shining the laser light through it. It was sometimes surprisingly challenging to catch a worm, but also kind of fun. I quickly learned how to keep the worm in the laser light. If it moved out of the light, the Picoscope graph would flat line. The Picoscope graphs the voltage induced by the diffracted light hitting a photosensor.
Soon after, Bryan told me about a side project Professor Magnes asked him to work on. When I showed interest, he asked if I wanted to work on it with him. Our goal is to program an Arduino to collect the diffraction pattern data caused by the C. Ellegans movement and output the thrashing frequency. We started by buying an Arduino starter kit, which came with a lot of useful supplies including resistors, breadboards, an Arduino, buttons, and a project book. I worked with Arduinos a little during the first semester of my senior year of high school, so I was excited to use them again. We started by reading the project book and trying projects to become acquainted with the Arduino and learn how to use it. I began with the basics: setting up an LED and getting it to blink, which was very easy. I then moved on to more complex projects. Bryan created a “crystal ball” that wrote yes/no responses on an LCD when the Arduino was tilted. He was having trouble getting it to work, but I managed to find a problem with how he wired it.
He thought LCD screens might come in handy, so I did a little research on how to program and use them. I found a light meter project online, which measured the levels of light in the room using a photosensor and displayed the percent brightness on an LCD screen. It seemed like it might teach me skills that could be useful for the project so I decided to build it. However, the code used functions that were not compatible with the Arduino and LCD I was using. Nonetheless, it provided a useful, general outline to work from. I was able to write my own code and use my newfound LCD knowledge to program the light sensor.
Next I moved on to learning to output graphs with the Arduino, another potentially useful tool. I used Processing, an open source programming language and development environment that is compatible with Arduinos. I found instructions for graphing Arduino serial monitor data using Processing on the Arduino site, and successfully graphed data collected from the light sensor in real time. However, I was not satisfied with the graph because it had no axes or scale. I found a more complex graphing code online, and got it to work. I edited the code to have more informative y-axes, which represented voltage, and added x-axes for time.
For some reason, the newer photosensor was not working properly with the Arduino. Bryan gave me the task of trying to fix it. I hooked the photosensor up to analog pin 0 on the Arduino, and sent the data it received to the serial monitor. Then I shone the laser light through the optical chopper and observed the values in the serial monitor. I noticed that it actually was working, but was producing only a very small change in voltage. When I graphed this, it showed a standard square graph, as expected. I messed around with the Arduino code trying to make the voltage difference larger, but I was not convinced that was the right solution. This would not improve the connection between the Arduino and photosensor or give more accurate results. I did not make much more progress on this front since I ran out of time, although it did seem to be working fairly well. I did some testing to see how accurate it was. At very high frequencies, the Arduino and graphing code had some trouble keeping up, but for our purposes it should work fine.
Bryan’s initial idea for the Arduino project was to use Fourier transforms. However, we quickly moved on to RLC circuits. I researched both of these concepts since I was unfamiliar with them. Bryan was having trouble successfully making an RLC circuit and spoke with someone in the Physics department about it. Apparently, RLC circuits are great in theory, but a little difficult to get to work in reality. We were unable to solve this problem last semester. I did a little research over the break, and my current idea is to either buy or build a band-pass filter. I could not find one online that allowed low enough frequencies through, but plan on searching more in depth when I get back to the laboratory next week. If that fails, I found an Instructables post about making one that looked promising, and I will attempt to make one myself.
Link to instructables post: http://www.instructables.com/id/Active-Band-Pass-Filters/?ALLSTEPS