Final Week!

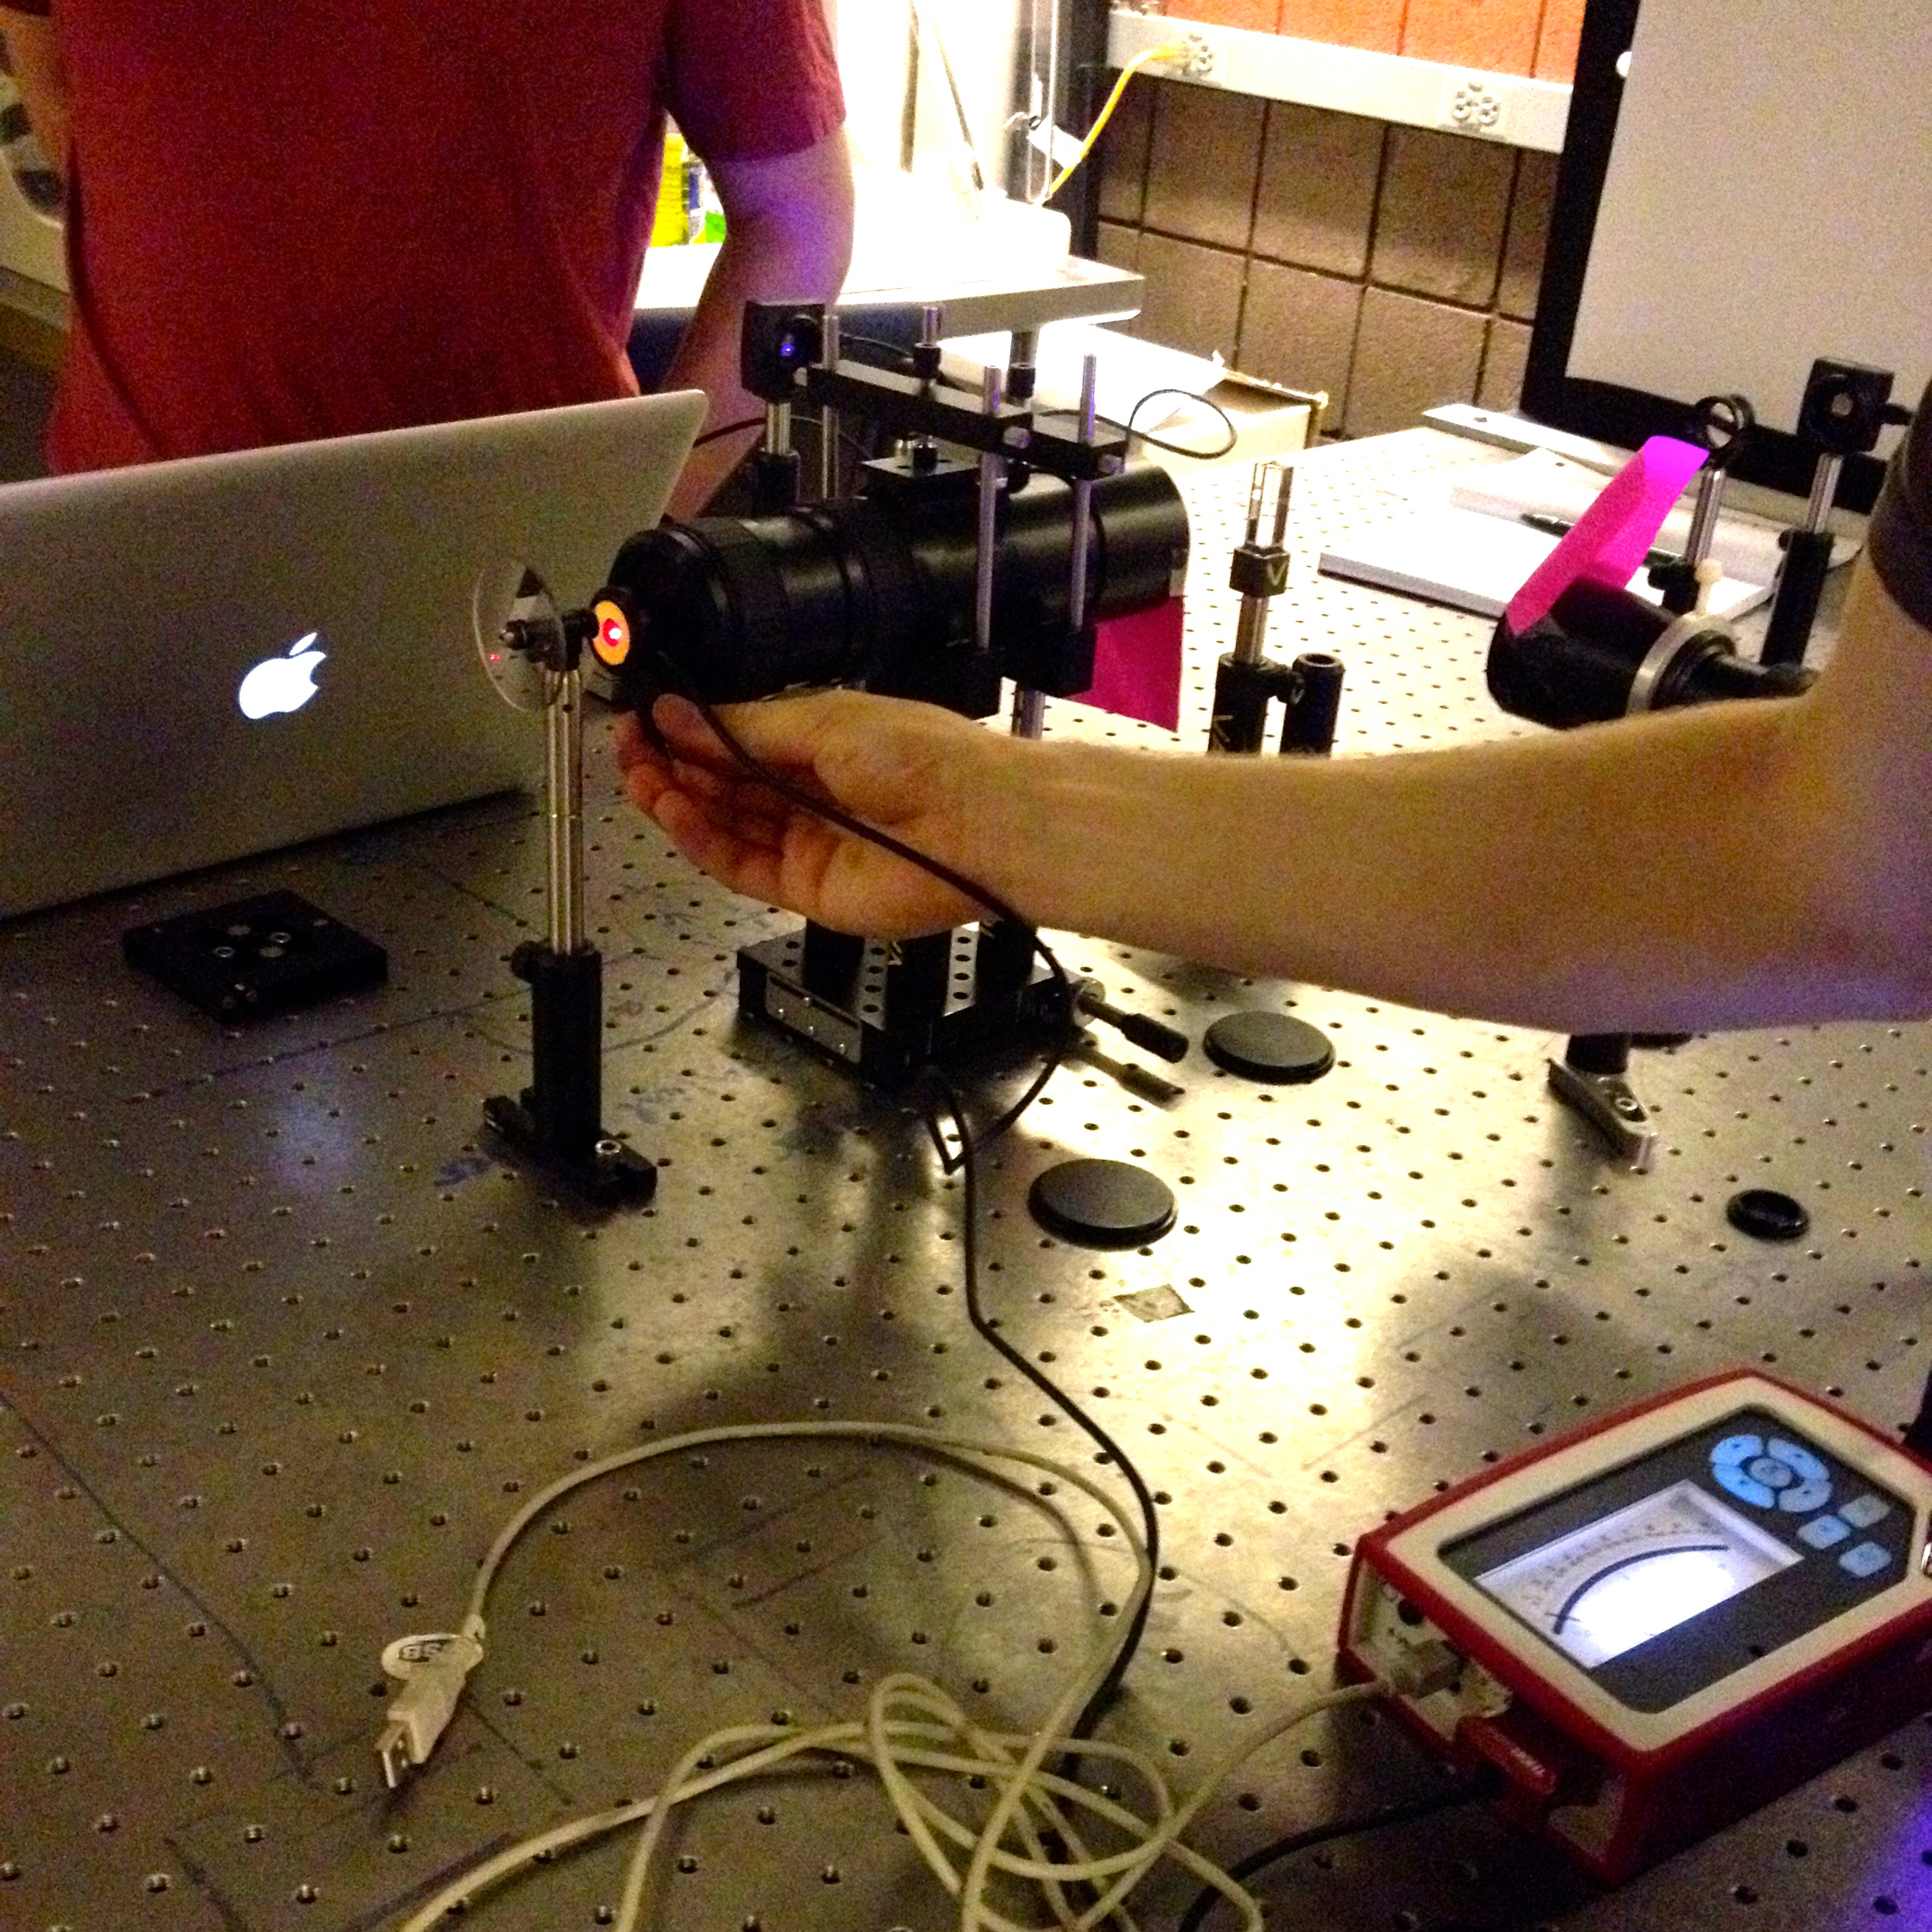
It is sad to say that this will be the last post for the academic year; however I have enjoyed working in the VAOL with Brian, Tewa, and Lily and would like to do so again in the future. For the last week of classes we spent a last bit of time analyzing the test videos that we took to ensure the equipment was set up properly and then began the testing that would happen in large amounts for huge sets of raw data.

Brian and I went through the small amount of test videos and quickly recorded anything that the worms did that wasn’t falling normally under gravity.

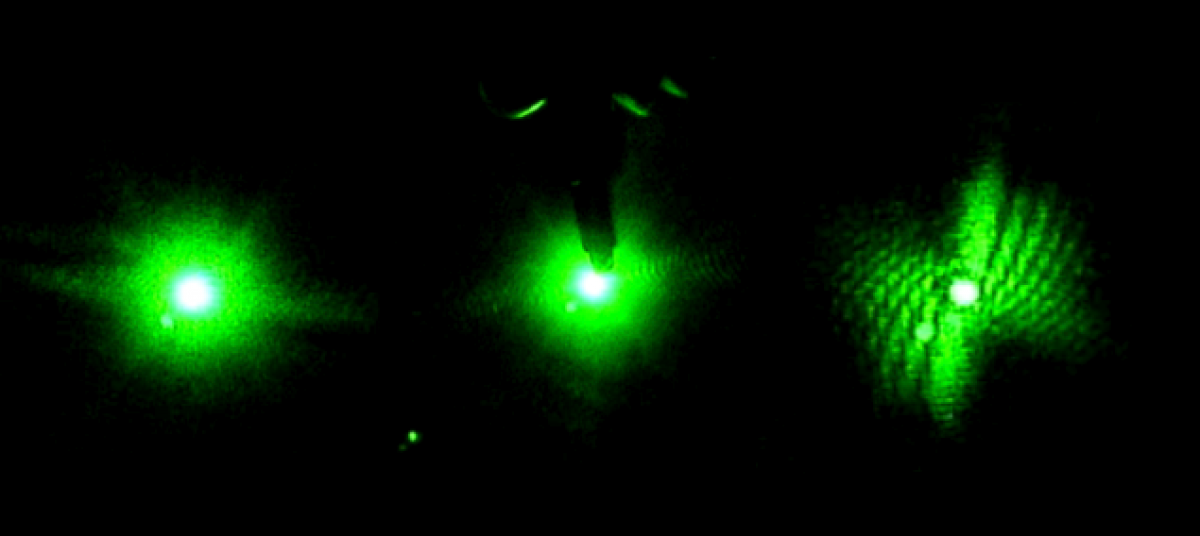
In the Red and Blue laser set up a worm hovered in the red light at 52 seconds in video 04-04-01, and another worm hovered at 1 minute 16 seconds in the blue light in video 04-04-03. One odd occurrence happened in the videos of dead worms at 3 minutes in the blue light a worm decelerated at an extreme amount which I also believe was caused by a current.

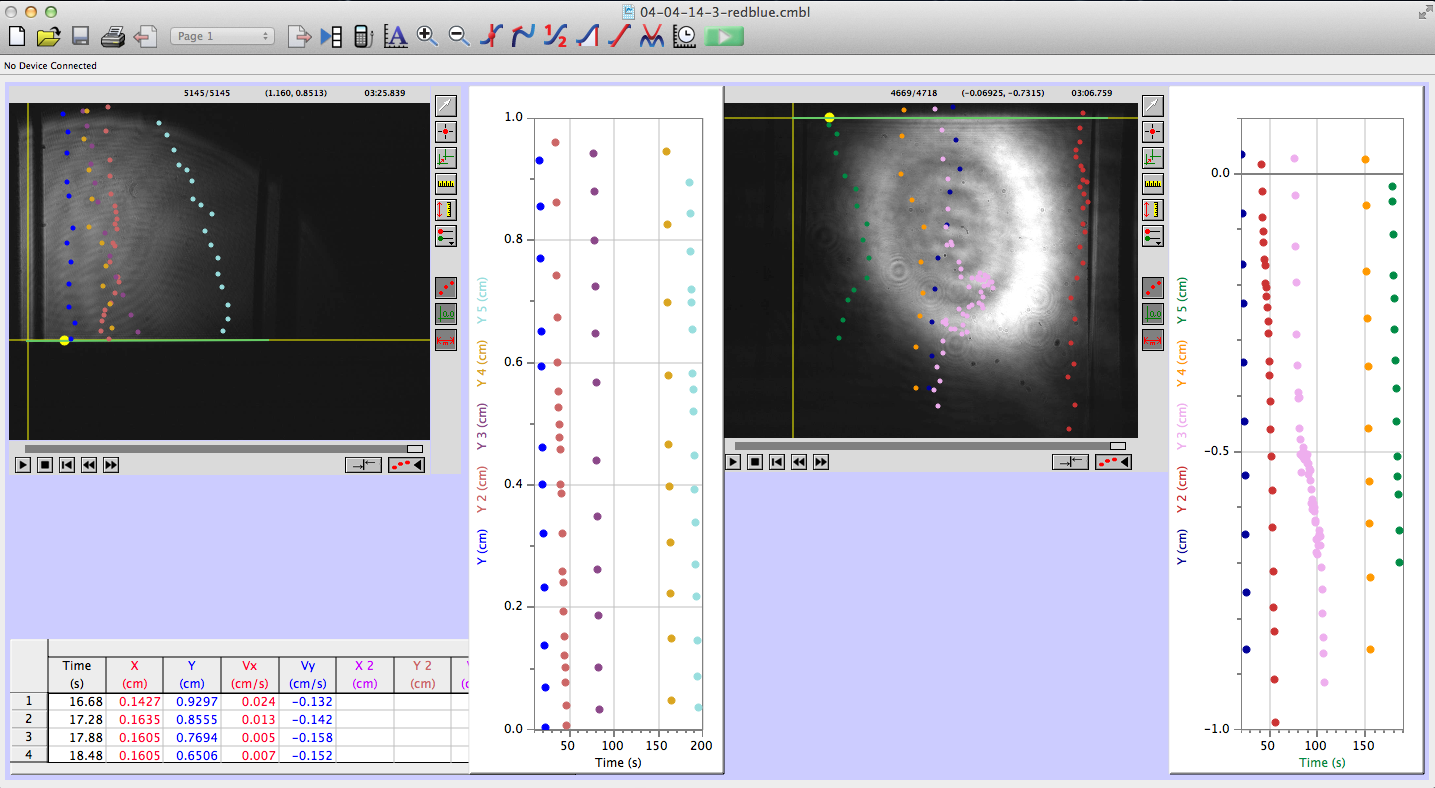
In the Green and Blue laser set up we noticed a worm make a slight turn around at 3 minutes 45 seconds in green light in video 04-07-01, but a current seemed to be the cause as well. However, in video 04-07-02 at 52 seconds a wormed turned around of it’s own accord.Overall, the data seems to suggest that some worms are reacting to the change in light; however, it is not an extremely consistent habit for them to attempt escape from the blue light. Given more time I would like to test the worms under the change into the beam of a UV laser which was mentioned in previous posts. The testing that we began used the same set up and the same methods during the test videos except we set the frame rates on each camera to be the same so that the video speed would remain consistent while analyzing the data in logger pro.

week 8

Last official update!

This week, along with taking more data, we also took a cursory look at all the videos so far and simply counted how many worms “turned around” or “hovered” during the data collection. This was just to take a step back and get a sense for what rough results we were getting as to whether the worms have a sensitivity to different wavelengths of light. The results of that:

Red and Blue Lasers

Live Videos:

04-04-01 red – 0:52  hovering

04-04-03 blue – 1:16  hovering

Dead Videos:

04-04-01 blue – 3:00  extreme deceleration (the worm is dead though, so probably due to currents)

Green and Blue Lasers

Live Videos:

04-07-01 green – 3:45 (video 1)  slight turnaround (maybe due to a current)

04-07-02 green blue video – 0:52 (video 2) turnaround


This data is from 6 (or so) total videos. This data hints that the worms may have a sensitivity to the different wavelengths of light, but is inconclusive so far.

Again, this week we took data with the blue and red lasers.

IMG_3044

This image features the beam expander for the red laser, and Brian testing the power of the red laser. It is necessary for the two lasers to be producing the same power output for the experiment to be valid. (Note the setup: in view in order from left to right is the: neutral density expander, the power gauge held by Brian, the beam expander, the tiny cuvette, then the little black square of the CCD camera, and the white screen.)


This semester of research has been so eye-opening and informative to me personally and I feel that it is important to reflect briefly. I have learned through experience that experimental research is not smooth sailing: it requires ingenuity and patience facing the constant barrage of small problems in need of a solution. It is also quite rewarding and easy to invest in– keeping in mind the overall goal of the project, it is fun and easy to fall into the small details and celebrate every small victory. I have found this very rewarding, and am quite excited to continue in the field of research.

Weeks 6 and 7

In the lab for the past couple of weeks we have been analyzing all of the data we have taken. We did this after we have only taken a few tests mainly to ensure that nothing is going wrong with our data setup so that when we take a massive amount of data it is good to analyze.

Most of the time analyzing the data involves clicking on a video in Logger Pro to track the worms’ movement through the cuvette. As you can see in the picture below, I decided the way I wanted to analyze the data was to have the video from both the red and blue halves of the cuvette on the screen at the same time so that I could track the progress of a worm from one half to the other.

Screen Shot 2014-04-18 at 12.24.22 PM

Something odd was happening though where the videos from the blue laser side seemed to take longer to play out and everything seemed to move at a slower pace. Tewa discovered that the frame rate on the blue CCD camera was not set at the same rate as the red; however, a short amount of time in the lab showed that the frame rates can be set on each camera before testing begins, which we will be sure to set at 25 fps from now on

Social Widgets powered by AB-WebLog.com.