Category Archives: Rebecca

Static Light Scattering-Results

Origin Graph Depicting Scattering Intensity vs. Concentration

Using the theory of Static Light Scattering a graph was made for particle size 105 nm (in diameter) for volumes 1000, 2000, 3000, 4000 microliters and the predicted scattering intensity was found using Equation [3].  The wavelength used was 632.8 nanometers (red in the visible spectrum) so the particle size was within the Rayleigh limit.  The scattering intensity was then plotted as the concentration of the particles was varied.

1/y-intercept was supposed to yield the molecular mass of a particle in Daltons.                    (1 Dalton=1amu).  A linear fit was applied to the graph in order to find the y-intercept.  As shown on the graph the y-intercept was found to be  $2.3*{10^{-12}}$

which yields a molecular mass of approximately  $4.5*{10^{11}} $ Daltons

In order to calculate the actual molecular mass of the microspheres the 2SPI website was used.  Here’s the link: http://www.2spi.com/catalog/standards/microspheres.shtml

The approximate concentration listed on the website of the 0.105 micrometer spheres was ${10^{3}}$ particles/mL

The bead density was approximately $1.05$ grams/mL

which meant that each particle was approximately $1.05*{10^{-16}}$ kg

In order to convert between kilograms and Daltons it is important to note that $1.022*{10^{-27}}$ equals approximately 1 Dalton.

This yielded a molecular mass of $1.1*{10^{11}}$ Daltons

While the calculated molecular mass and the actual molecular mass are on the same scale (both ${10^{11}}$) the answer is still off by a factor of about 3 to 4.

This error may stem from the many approximations used when calculating the actual molecular mass.  The number of particles/mL was estimated on the SPI website.  Also the bead density was approximate.  Since these polystyrene microspheres are mass produced it cannot be guaranteed that every particle is the exact same size and a perfect spherical shape.  There will also be slight variations in the particle densities across different containers.  However the particles need to meet certain standards, so the error is limited, but could possibly account for the small differences between the actual and calculated molecular mass.

In addition, since the slope was found to be $1.057*{10^{-9}}$ (which is greater than zero) it would appear, based on Static Light Scattering Theory, that the particles will stay in a stable solution.  This information was confirmed on the 2SPI MSDS data and safety sheet for these microspheres (the sheet claims the solution formed with these sphere is stable).

Just for reference it seems like the method I used for calculating the molecular mass based on Static Light Scattering Theory is not the easiest, quickest, nor most accurate method.  Equipment can be purchased that measures the intensity of the samples at different concentrations, compares it to a known standard, and outputs a Debye Plot which calculates the molecular mass and the gradient of the graph.  However, it can be important to test theories in a more controlled method where every step of the process is known in order to check the accuracy of the theory and learn exactly how the equipment works.


Share

Light Scattering-Results

For my project I also wanted to look at the Rayleigh predicted scattering intensity for a particle size larger than the Rayleigh limit and compare that to the Rayleigh-Debye predicted scattering intensity.

Polar plot depicting the Rayleigh Relative Scattering Intensity for scattering angles from 0 to 360 degrees for Particle Sizes larger than the Rayleigh limit

The wavelength used was 400 nm or violet light in the visible spectrum since this is the shortest wavelength in the visible spectrum and as a result has the smallest Rayleigh limit.  The particle sizes used were 50, 60, 70, 80, 90, 100 nanometers in diameter.

Polar Plot depicting the Rayleigh-Debye Relative Scattering Intensity for scattering angles from 0 to 360 degrees.

The same particle sizes and wavelengths were used as in the Rayleigh scattering graph above.

As you can seen in the graphs above the Rayleigh predicted scattering intensity is the same for forward and back scattering.  While the Rayleigh-Debye predicted scattering intensity occurs mainly in the forward direction.  Larger particles (outside the Rayleigh limit) should scatter more light in the forward direction, as in the Rayleigh-Debye graph, which shows that the form factor introduced in Equation [5] is necessary to predict the scattering intensity of larger particles.

Here is a link to show the differences between Rayleigh Scattering and Mie Scattering as particles become larger in size. http://www.mwit.ac.th/~Physicslab/hbase/atmos/imgatm/mie.gif

The similarities between the image of Mie Scattering depicted in this link and the Rayleigh-Debye scattering shown in the graph above suggest that the Rayleigh-Debye equation is both an accurate and simpler method for calculating the scattering for particles larger than the Rayleigh limit.

Below is a link to all the Mathematica files used to create the preliminary results, these results, and find the concentration and scattering intensity used in the testing of the Static Light Scattering Theory.

https://vspace.vassar.edu/xythoswfs/webview/fileManager?stk=60D409B61FE706E&entryName=%2Freeells%2FScattering&msgStatus=

Share

Scattering-Preliminary Results

Graph of Predicted Scattering Intensity vs. Wavelength (for different particle concentrations)

Equation [3] was used in order to predict the scattering intensity as a function of wavelength (within the visible spectrum) for different volumes, or concentrations, of particles.

The diameter of the particle used to create this graph was 105 nm.  In order to determine the refractive index of the particles used I looked at the refractive index of polylatex microspheres that I have previously worked with in the VAOL lab.  The refractive index of these microspheres was 1.59.  The refractive index of water is 1.33.  The length of the cuvette was also determined from previous lab work and was approximately 1 cm.  The incident intensity was also taken from experimental data and the value used was 0.365 Volts.  The volume of particles used ranged from a “dropsize” of 20 microliters to 45 microliters in 5 microliter increments.

As shown in the graph above, the predicted scattering intensity increasing as concentration of the particles increases.  This makes sense because as the number of particles in the cuvette increases show does the chance that the light will interact with a particle(s) resulting in more scattering.   From this graph it also appears that light is scattered more (at 90 degree side scattering) for shorter wavelengths.  This result is consistent with Rayleigh theory.  (And also explains why the sky is blue!  Longer wavelengths mostly pass right through the atmosphere, but shorter wavelengths–like blue light–are scattered in every direction.  So no matter what direction you look some scattered blue light reaches your eyes!)

Polar Plot depicting the Rayleigh Relative Scattering Intensity for scattering angles from 0 to 360 degrees as Particle Size increased (for wavelengths within the visible spectrum and particles within the Rayleigh limit)

The color of the plot shows the color of the light (wavelength) used.  The particle sizes used depended on the wavelength of light used (since Rayleigh scattering is wavelength dependent and for longer wavelengths larger particles can be used within the Rayleigh limit).  A volume of 200 microliters was used.  The cuvette length, incident intensity, refractive index of the particle, and the refractive index of water were all kept the same as for the graph above.

The graph (below) is a composite image of the polar plots for the different wavelengths (above).

These graphs show that larger particles scatter more light.  That is why the purple and blue  wavelengths have such a small scattering intensity when compared with the orange and red, even though purple and blue wavelengths should be scattered more.  The particle sizes for these wavelengths, however, had to be smaller than for red or orange because Rayleigh scattering is wavelength dependent and can only accurately predict scattering intensities for particles less than one-tenth the wavelength of light.

Since the graph above can be misleading because it may make it appear that longer wavelengths (like red) are scattered more than shorter wavelengths (like purple) for Rayleigh scattering, even though (as I said above) the reason is due to particle size and the Rayleigh limit being larger for longer wavelength, I’ve included a graphs (below) of Rayleigh scattering that are identical to graphs above except the particle sizes were held constant for all the wavelengths.

These graphs show that for Rayleigh scattering shorter wavelengths are scattered more than longer wavelengths and that larger particles produce more scattering.

Polar Plot depicting the Rayleigh-Debye Relative Scattering Intensity for scattering angles from 0 to 360 degrees as Particle Size increased (for wavelengths within the visible spectrum and particles greater than the Rayleigh limit)

The color of the plot shows the color of the light (wavelength) used.  The particle sizes used were the same for every wavelength.  The size ranged from 100 to 200 nanometers in increments of 10 nanometers.  A volume of 200 microliters was used.  The cuvette length, incident intensity, refractive index of the particle, and the refractive index of water were all kept the same.

The graph (below) is a composite image of the polar plots for the different wavelengths (above).

These graphs show that shorter wavelengths scatter more light (as expected) when the particle size range for each wavelength is identical.  These graphs also show that for Rayleigh-Debye scattering most of the light is scattered in the forward direction.

Share

Scattering-Proposal (Revised)

Project Outline

For my project I would like to build on the work of a previous student, Rahul Khakurel, who also explored Rayleigh scattering.  However the form of the Rayleigh theory I will be working with is modified to include different variables.  These variables would be easier to measure in an experimental setting and can be manipulated to observe the effect on the scattering intensity.

Link: http://pages.vassar.edu/magnes/applied-quantum-mechanics-and-optics-phys-375/rahul-khakurel/

The Rayleigh theory of light intensity for scattering by a single particle is:

(1)   \begin{equation*} I_R=I_0((1+cos\theta)/2R^2)(2\pi/\lambda)^4((n^2-1)/(n^2+2))(d/2)^6 \end{equation*}

R=distance to the sample, θ=scattering angle, n=refractive index, d=diameter of the particle

The cross section of one particle is:

(2)   \begin{equation*} \sigma=(2\pi^5/3)(d^6/\lambda^4)((n^2-1)/(n^2+2))^2 \end{equation*}

 (Zare et al., Laser Experiments for Beginners)

However, I would like to look at the scattering for multiple particles suspended in a solution with water.  The equation I will be using is:

(3)   \begin{equation*} I=I_0\sigma N n_{water} l (1+cos^2\theta) \end{equation*}

I0= incident intensity, σ=scattering cross section (same as for single particle), N=particle density, nwater=refractive index of water, l=cuvette length, θ=scattering angle

All of these variables can be manipulated, except for the refractive index of water.

The Rayleigh coefficient, which is the particle cross section multiplied by the particle density of the cuvette., accounts for the likelihood of scattering given particle size and density.  The likelihood of scattering is also dependent on the distance the light travels through the sample, or the length of the cuvette.  As the light passes through the sample it is also refracted by both the particles and background medium.  (For my modeling purposes the background medium is water).  The 1+cosine term accounts for the phase shift between the incident light and the scattered light based on the angle between the incident beam and the observed scattered light.  The incident intensity is the amount of light entering the cuvette and is also the maximum intensity of light that could be scattered.

I am assuming for the purposes of modeling that the particles do not absorb any of the light and that they are spherical in shape.

Just for reference, here is the equation Rahul was using:

(4)   \begin{equation*} I=({NV^2}/{r^2\lambda^4})I_0f(n_1,n_2) \end{equation*}

N=number of spheres, V=volume, r=distance to observer, λ=wavelength, I0=incident intensity, f=function taking into account differing refractive indices

For his work he set the distance to the observer, incident intensity, and the function taking into account the differing refractive indices all equal to one.

When the particle size is no longer within the Rayleigh limit the Rayleigh-Debye equation will be used.  This equation introduces a unitless form factor to the Rayleigh theory so that the theory can be applied to particles larger than the Rayleigh limit.  (Simple alternative to Mie scattering, which accurately predicts scattering for larger particles but is quite complicated.

The Rayleigh-Debye equation:

(5)   \begin{equation*} I=I_0\sigma N n_{water} l (1+cos^2\theta)P(\theta) \end{equation*}

the form factor (Kerker, The Scattering of Light):

(6)   \begin{equation*} P(\theta)=[(3/u^3)(sin(u)-ucos(u))]^2 \end{equation*}

(7)   \begin{equation*} u=2kasin(\theta/2) \end{equation*}

(8)   \begin{equation*} k=2\pi/\lambda \end{equation*}

a=particle radius and all the other variables are the same as for the Rayleigh equation

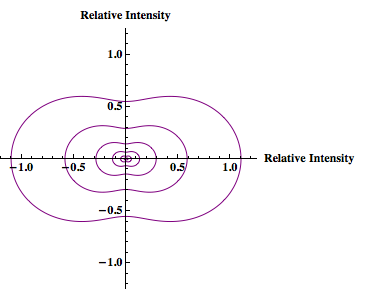
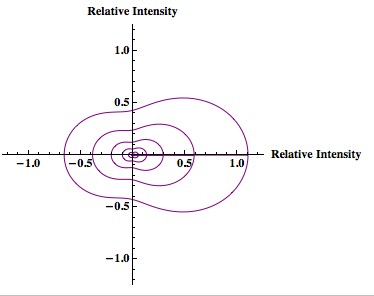
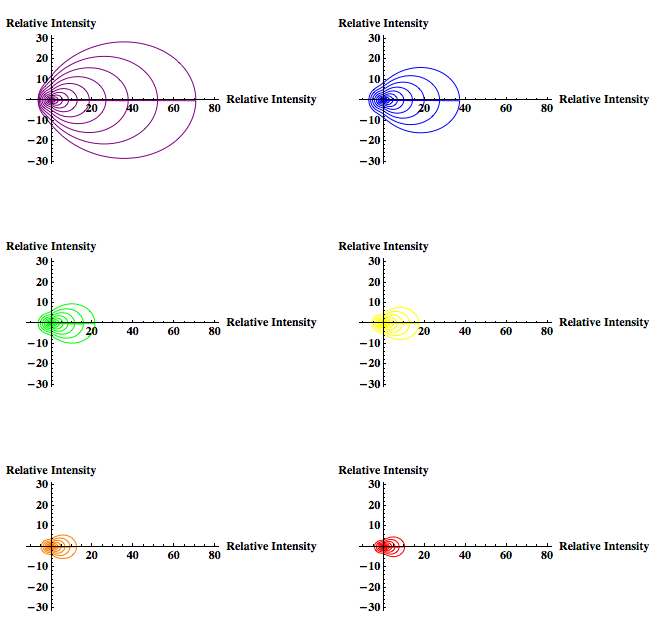
Please Note: In the equation for the form factor the entire function MUST be squared.  In Laser Experiments for Beginnings by Richard Zare the form factor equation does not have the squared term.  However he references the book by Milton Kerker and the equation is supposed to have a squared.  This would explain the weird “tails” of x-axis negative intensity that Rahul’s graphs had.  The graphs should have forward  x-axis scattering only.

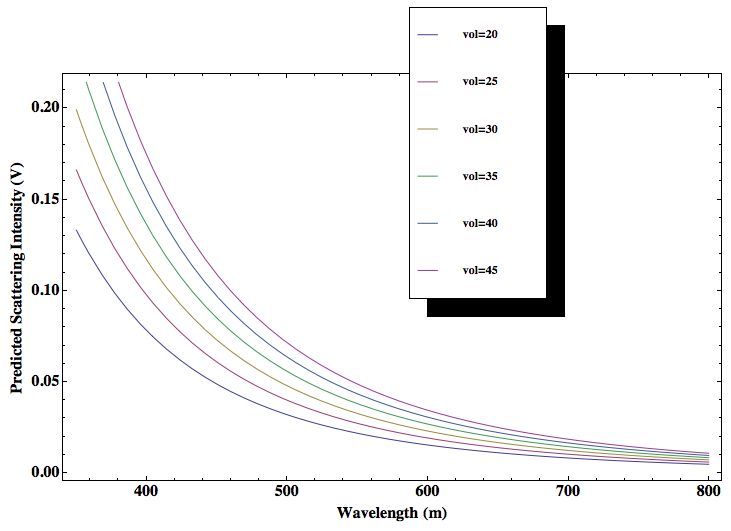
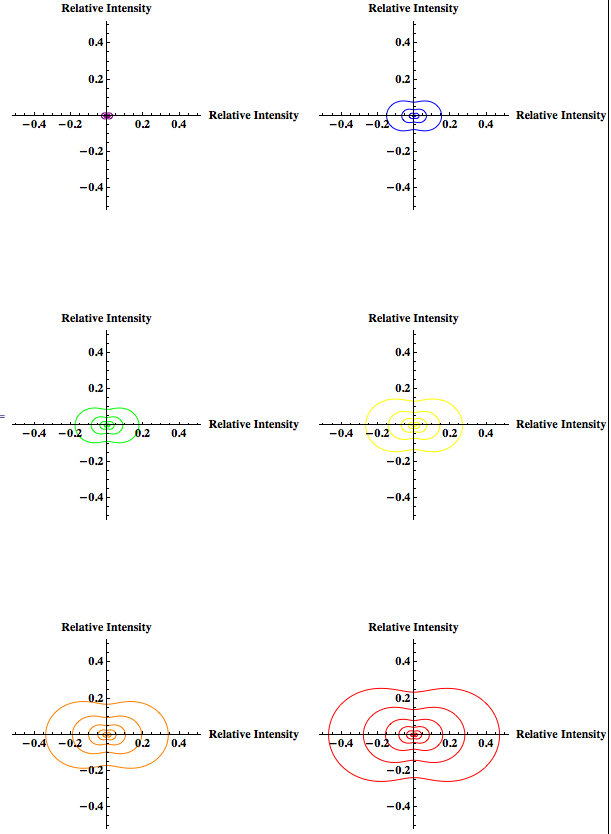
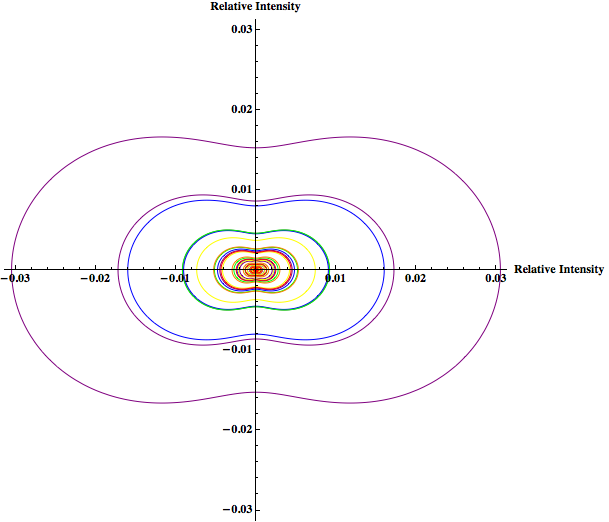
I would like to first make a graph that predicts the how the scattering intensity changes as a function of wavelength for a varying number of particle densities (but a controlled particle size within the Rayleigh limit).  This graph will be made using Mathematica and the wavelengths used will be the visible spectrum.  The scattering intensity will be measure at 90 degrees—the angle at which there is maximum scattering intensity for Rayleigh scattering.

Previously Rahul modeled the Rayleigh light scattering as the particle size changed from 2nm to 902nm for yellow light.  Since Rayleigh scattering is wavelength dependent I would like to show how scattering changes as particle size changes (within the Rayleigh limit) for other wavelengths of light in addition to yellow—like red, green, and blue—to explore whether the change in scattering becomes more for certain wavelengths.  The concentration will be held constant.  This will also be done using Mathematica.

I will then look at the scattering intensity for the range of particles just under and just over the Rayleigh limit for the same wavelengths used in the graph of particles within the Rayleigh limit using both the Rayleigh and Rayleigh-Debye factor, which introduces a correcting form factor.  This is to observe the predicted intensity around the boundary of the Rayleigh limit, and how that intensity varies due to the introduction of the form factor.

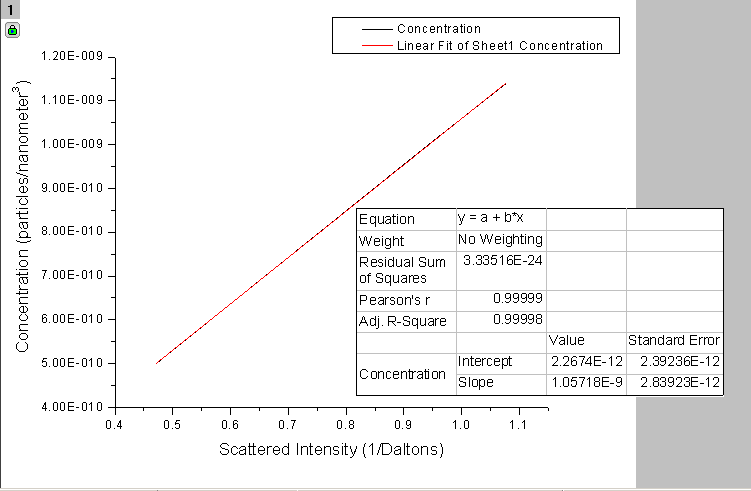
The goal of predicting the scattering intensity would be to explore Static Light Scattering.  Static Light Scattering uses the scattering intensity predicted by the Rayleigh theory (at a 90 degree scattering angle) and the concentration of the cuvette to determine the molecular weight of the particles.  Molecular weight can be measured, in theory, by creating a Debye plot (Intensity of scattered light vs. concentration) and finding the intercept at zero concentration (which is equal to 1/molecular weight).  The gradient of the Debye plot is the 2nd Viral Coefficient (A2), which can be used to determine the interaction strength between the solvent and the particles.

A2 >0 the particles will stay in stable solution

A2 < 0 the particles may aggregate

A2 = 0 the particle-solvent interactions are completely balanced by the particle-particle interactions

Applications of Static Light Scattering:

Static Light Scattering has experimental application because it could be used to determine the weight of the molecules in an unknown solution.  By comparing the experimentally determined weight to predicted molecular weights, it may be possible to determine the identity of the molecules.  And particle aggregation can be applied to proteins.  Protein aggregation can be used as an important marker in many diseases.  A “normal” solution taken from a healthy individual can be used as a standard and compared to solutions taken from patients as an early detection method (if the protein aggregates indicates disease).

There are a couple quick checks to determine if the Rayleigh theory is accurate.  The first would be to look at the predicted scattering intensity.  This intensity should not be greater than the incident intensity.  Another check would be that the predicted scattering intensity for the Rayleigh theory is greatest at 90 degrees.  For the Rayleigh-Debye equation the forward scattering should be the greatest.  Both the Rayleigh theory and Rayleigh-Debye theory can be checked experimentally by actually making a solution and measuring the scattering intensity for a given wavelength.  The experimental parameters would provide values for the variables in the Rayleigh (and Rayleigh-Debye) equation.  With those values the predicted scattering intensity could be determined and compared to the actual scattering intensity.  In order to check the Static Light Scattering, the molecular weight of a particle with a known molecular weight could be predicted and then compared to that known weight.

REFERENCES:

Kerker, Milton. The Scattering of Light and Other Electromagnetic Radiation. New York:  Academic Press, 1969

Zare, Richard N., Bertrand H. Spencer, Dwight S. Springer, Matthew P. Jacobson. Laser Experiments for Beginners. Sausalito: University Science Books, 1995.


Share

Light Scattering

Project Proposal

When light travels through a medium that is not a vacuum the electric field of the electromagnetic wave induces oscillating electric dipoles in the atoms and molecules that compose the medium.  These induced dipoles affect the propagation of the waves and can also scatter the light in various directions.  For particles that are smaller than one-tenth the wavelength of the incident light Rayleigh scattering is observed.  For these small particles the scattering can be predicted by the Rayleigh theory.  By manipulating variables in the Rayleigh theory such as particle size and density, scattering angle, and wavelength, I want to numerically predict and model different scattering intensities using Mathematica.  In addition I want to approach the particle size limit for Rayleigh theory to observe what happens to the modeled scattering and compare that to Rayleigh-Debye modeled scattering, which can be used to predict the scattering of particles larger than the Rayleigh limit.

Share