
Electrochromism
Blog Proposal
Just as a refresher, this was my proposal: I plan on studying electrochromism for my blog project. Electrochromism is defined as a reversible optical change in a material that is induced by the application of an electric potential. By altering the applied voltage, you can produce different colors. I did a project on this last year and I plan on using the data I collected to compare applied voltage to resulting color. Griffiths talks about skin depth, which is a measurement of how far a wave penetrates into a conductor. I am going to play with this formula on mathematica. Using my data, I will be able to determine the current based on the voltage and resistivity and as a final calculation, I am going to graph current versus skin depth.
Introduction
Electrochromism is defined as a reversible optical change in a material that is induced by the application of an electric potential. Tungsten oxide and other transition metal oxides of NI, Co, and Ir, have been extensively studied and shown to exhibit colors throughout the visible spectrum. Conductive organic polymers have also been shown to exhibit electrochromatic behavior, and are advantageous because they are usually transparent in the ground state. Organic polymers are suitable for applications in semiconductors, transistors and LEDs. Organic polymers whose band energy gaps are small, so that the energy needed to release the electron charge carrier can be smaller, are suitable for the organic layer of electrochromatic devices.
Here is a short clip demonstrating electrochromism:
What is actually happening?
Constructing the device
Electrochromism occurs when there is an oxidation or reduction reaction between the organic polymer layer and the electrolyte layer. Through chemical doping, (p-doping for oxidation and n-doping for reduction) the organic layer displays characteristics of increased conductivity and reversible optical changes.
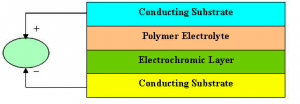
The device consisted of two Indium Tin Oxide coated glass plates with a layer of electrolyte gel sandwiched between them. One of the ITO sides was coated with a layer of polyaniline (PAN) and adhered to the slide with a thin layer of polyvinyle alcohol (PVA) film.
This is what our final device looked like:
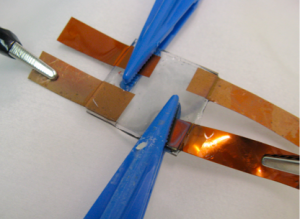
The final structure consisted of: glass/ITO/PVA/PAN/electrolyte gel/ITO/glass. Two copper leads were inserted; one between the electrolyte and the ITO and the other between the electrolyte and the PAN film. With these leads, we were able to apply a voltage cross the device.
Data and Results
After much difficulty, we were able to construct a working device. We measured different voltages and the resulting colors. For my project, I have taken the measured voltage and witnessed color and compared it to the skin depth.
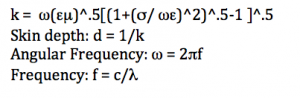
For this project, I used four equations and made several assumptions.
Equations:
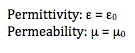
Assumptions:
Conductivity: 1.68E8 (copper); because we used copper wire to connect the device to the power source.
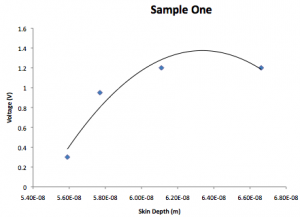
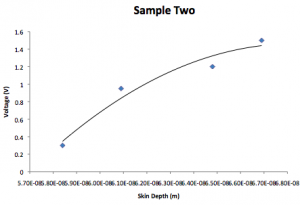
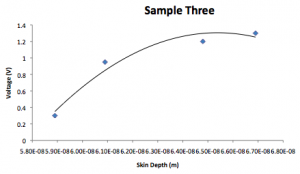
We measured three different samples. Below you will find the data and results from each sample. For each voltage, I predicted what color was being absorbed in the sample based on what color we saw. From here, I calculated the angular frequency, k value and skin depth. I graphed voltage versus skin depth.
Visible spectrum and corresponding wavelengths.
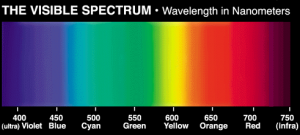
http://www.gamonline.com/new/catalog/colortheory/images/spectrum.gif
Sample 1:
| Voltage (V) | Visible color | Absorbed color | Wavelength (nm) | AngularFrequency |
| 0.3 | Clear | Red | 630 | 2.99E15 |
| 0.95 | Light green | Orange/Yellow | 590 | 3.19E15 |
| 1.2 | Blue | Green | 530 | 3.56E15 |
| 1.2 | Purple | Blue | 450 | 4.19E15 |
| Voltage (v) | k | Skin depth (1/k) |
| 0.3 | 5.59E8 | 5.59E-8 |
| 0.95 | 5.77E8 | 5.77E-8 |
| 1.2 | 6.11E8 | 6.11E-8 |
| 1.2 | 6.662E8 | 6.662E-8 |
Sample 2:
| Voltage (V) | Visible color | Absorbed color | Wavelength (nm) | AngularFrequency |
| 0.3 | Green | Yellow | 580 | 3.25E15 |
| 0.95 | Blue | Green | 530 | 3.55E15 |
| 1.2 | Purple | Blue | 470 | 4.01E15 |
| 1.5 | Deep Purple | Deep Blue | 440 | 4.28E15 |
| Voltage (V) | k | Skin depth (1/k) |
| 0.3 | 5.84E8 | 5.84E-8 |
| 0.95 | 6.09E8 | 6.09E-8 |
| 1.2 | 6.48E8 | 6.48E-8 |
| 1.5 | 6.69E8 | 6.69E-8 |
Sample 3:
| Voltage (V) | Visible color | Absorbed color | Wavelength (nm) | AngularFrequency |
| 0.3 | Blue/green | Yellow | 570 | 3.31E15 |
| 0.95 | Dark blue | Green | 530 | 3.55E15 |
| 1.2 | Blue/purple | Blue | 470 | 4.01E15 |
| 1.3 | Dark purple | Deep blue | 440 | 4.28E15 |
| Voltage (V) | k | Skin depth (1/k) |
| 0.3 | 5.89E8 | 5.89E-8 |
| 0.95 | 6.09E8 | 6.09E-8 |
| 1.2 | 6.48E8 | 6.48E-8 |
| 1.3 | 6.69E8 | 6.69E-8 |
According to Griffith, for a good conductor (like the elctrolyte used) you can assume that:
![]()
and then you are left with a k value that is roughly equal to:
![]()
Everything in this equation is a constant, so kappa depends on the square root of omega.
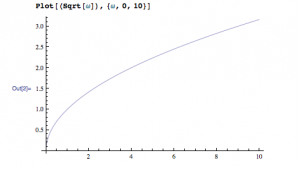
This is a mathetica graph of the square root of omega. As you can see, this vaguely looks like the three graphs I have above. I have set voltage as the y-axis and the skin depth as the x-axis, and the slope is equal to:
Voltage/skin depth
and d = 1/k
therefore, voltage grows as kappa increases and kappa is proportional to the squre root of omega.
Real Life:
Electrochromic cells are currently being used in “smart windows” to control the amount of light that passes through the window. By switching on a power supply, the window will become tinted. This application is also being used in cars. The idea is that tinted windows are dangerous at night when visibility is already limited. The driver will be able to turn on a power supply and tint the car windows depending on the exterior light conditions.
References:
———————————————————————————————————-
Here is my TM rectangular waveguide.
———————————————————————————————————–
———————————————————————————————————–
Journal Summary
I use my journal as a workspace to reflect upon problems and questions that have come up during class. Mostly, I use my journal to reorganize my notes and to begin rough work on homework problems. By reworking class problems and adding additional information into my journal, I have been using my journal as a study guide. Even though my journal helped me to study for the midterm, I think most of the work I am putting into it is a little redundant. Flipping through my past entries, I have found that the questions and concerns I did have were either answered during a class or I was able to figure them out through the homework problems. I think I get more out of homework problems, class lectures and peer discussions then I do from the journal

This is pretty cool. I too have never heard of electrochromism and it would really help if you could explained it a little more. And maybe add a discussion on your reasoning behind comparing the skin depth and the current. Some discussion on the real life applications of electrochromism, just to give it some more context, would also help.
Very cool! I’ve never heard of this effect before either. I have a couple suggestions on little things to change:
1) embed the youtube video instead of having a link.
2) make your graphs larger! they’re difficult to read.
Also, could you explain the process of electrochromism in more detail? What’s actually happening? I know it may be too late to add this to your blog, but just thought I’d put it out there.
Anyways, really nice job overall! I’d love to make art out of this!
So is this a project that you made/took data for last year at Dartmouth? This was really cool to read about; I’d never even heard of electrochromism before. Do you know if there are any practical applications of this effect? Either already in use or for future designs?