
Feb 8, 2010
Mathematica Notebook for Griffiths 4.10 vector fields:
————————————————–
Feb 17, 2010
So I’m not going to call this entry Snell’s Law for dielectrics because no matter how hard I tried I couldn’t actually get any total internal reflection. Hence, here is proof that Snell’s law fails for dielectrics:
Peace!!!
————————————————–
March 1, 2010
Modeling light propagation in ocean water
Sunlight is an important source of energy in the world’s ocean systems. It heats the ocean surfaces affecting sea surface temperatures which then controls the formation and variation of waves and current. In addition, it is a source of energy for marine organism, thus the transmission of light in sea water is an important phenomenon to ocean dwelling organisms. As light enters the ocean, it becomes absorbed by plants through the process of photosynthesis or reflected by particulate matter. Hence, in determining the light propagation in ocean water, variables such as the suspended particulate matter, dissolved organic matter and chlorophyll have to be determined, in addition to the temperature, salinity, and density of the water. Due to light attenuation, light intensity decreases with depth and it has previously been determine that light intensity falls to 1 percent of the incident light at a depth known as the photic zone. Therefore light attenuation is dependent on the density of dissolved matter, depth, time and the incident light intensity, thus to model light propagation an exponential decay model can be created using Mathematica. Finally, with this information, I will create a map indicating the estimated light penetration depths across the world’s oceans, enabling a comparison between the oceans.
————————————————–
March 22, 2010
Journal Summary
At the beginning of the semester, my journal began as a space for me to take additional notes from readings and useful equations and websites I came across outside of class. I would begin with a detailed entry of the assigned readings, and after the class period, I would make additional notes that clarified any difficult areas. Thus my journal was especially useful when taking quizzes and when preparing for the midterm. However, as the semester progressed, my journal entries became more of a space for recalling the equations covered in class, enabling me to organize the necessary equations in my own form of logic. I was able to use creative tools and methods to assist in my understanding of the subject area, such as color coding and creating diagrams that display the parallel between electrostatic and magnetostatic.
Though the journal was useful for helping to prepare for the midterm and for completing assignments, it was not very useful in helping me decide on a project area. This was probably due to the fact that I wanted to incorporate my major subject area (Earth Science) into the project, and my journal eventual became pages of color coded equations and flow diagrams. However, now that I have decided on a topic, I have used my journal to mull over ideas of possible methods and probable solutions.
In general, I think the journal can be very effective if enough effort is put into making frequent entries. I have found it most useful when preparing for the midterm, completing homework assignments and taking the quizzes.
————————————————–
March 30, 2010
Check out my cool wave animation here !!!
————————————————–
April 21, 2010
Modeling light propagation in ocean water

Introduction
When was the last you have been to the beach and taken in a big gulp of the salty sea water? Salinity is one of the most apparent and significant ocean water characteristic. As a semiconductor, salt water is able to absorb, reflect and transmit electromagnetic waves, thus resulting in light attenuation with depth. This characteristic varies across the world’s oceans and is usually more saline in the tropics than the arctic regions. As a result, since marine plants depend on sunlight for photosynthesis, then salinity influences the variation of organisms from shallow to deep sea regions and from equatorial to temperate regions. Global climate change is estimated to increase the world’s sea surface temperatures resulting in more evaporation in the tropics, thus increased saline conditions, and more melting in the Arctic, leading to sea ice and glacier melting, hence decreased salinity; hence the importance of ocean salinity.
Aim:
The model the effects of the variation in salinity on the absorption of electromagnetic waves in sea water.
Theory:
An electromagnetic wave propagating through sea water, a conducting medium, obeys Ohm’s Law:
Jf = σE
And using the continuing equation, the free charge density at time zero, dissipates in the time
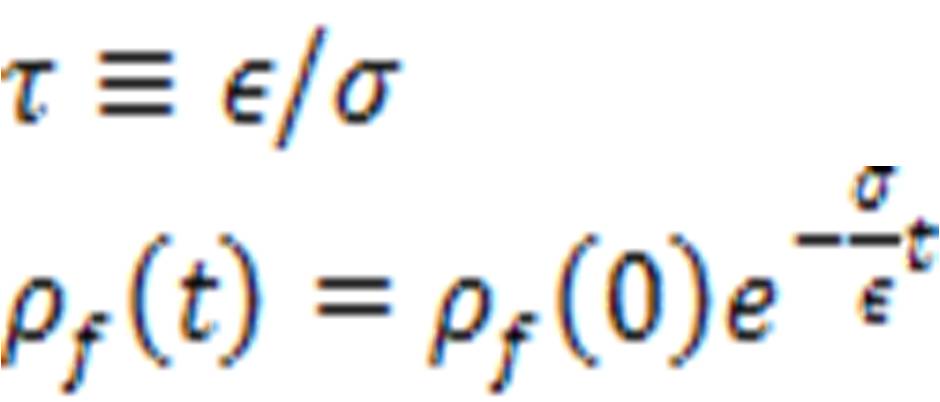
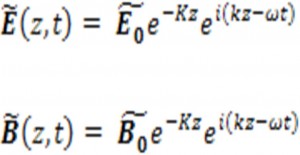
Hence the plane wave solution to Maxwell’s equations yields:
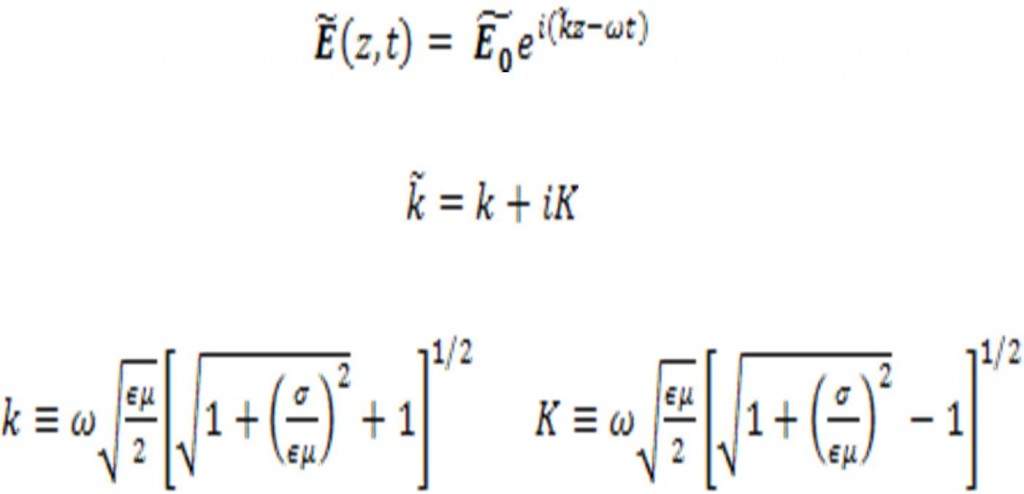
Then, the imaginary part of results in the attenuation of electromagnetic waves can be written as:
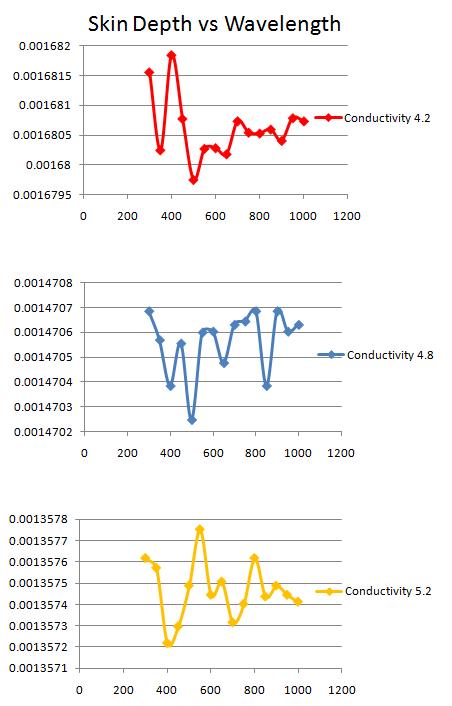
And the distance necessary to reduce the wave amplitude by a factor of 1/e is known as the skin depth:
d = 1/K
Additionally, absorption is determined by the absorption coefficient:
α = 2K
where the larger the coefficient, the more quickly it is absorbed.
Assumptions
Salinity affects the conductance of sea water.
In the Atlantic Ocean, salinity varies from 34 to 37 parts per thousand,
hence the conductance, σ = 4.2 – 5.2 S/m
For the visible range of the electromagnetic spectrum: 1.0 x 10¹⁵ – 3.0 x 10¹⁴ Hz
the angular frequency, ω, can be calculated since ω = 2πf
If the refractive index, n = 1.33
Since ε=εrε0 then permittivity can be determined
and since µ = (n2ε0µ0) / ε then µ can be calculated
Results
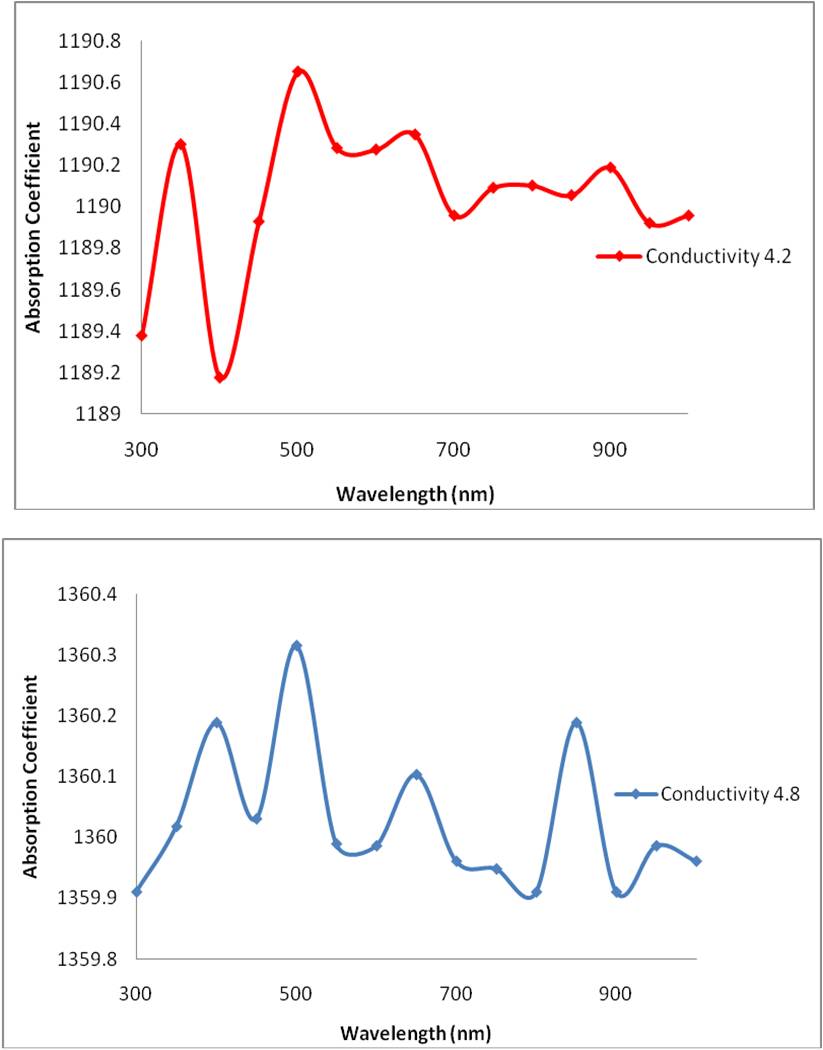
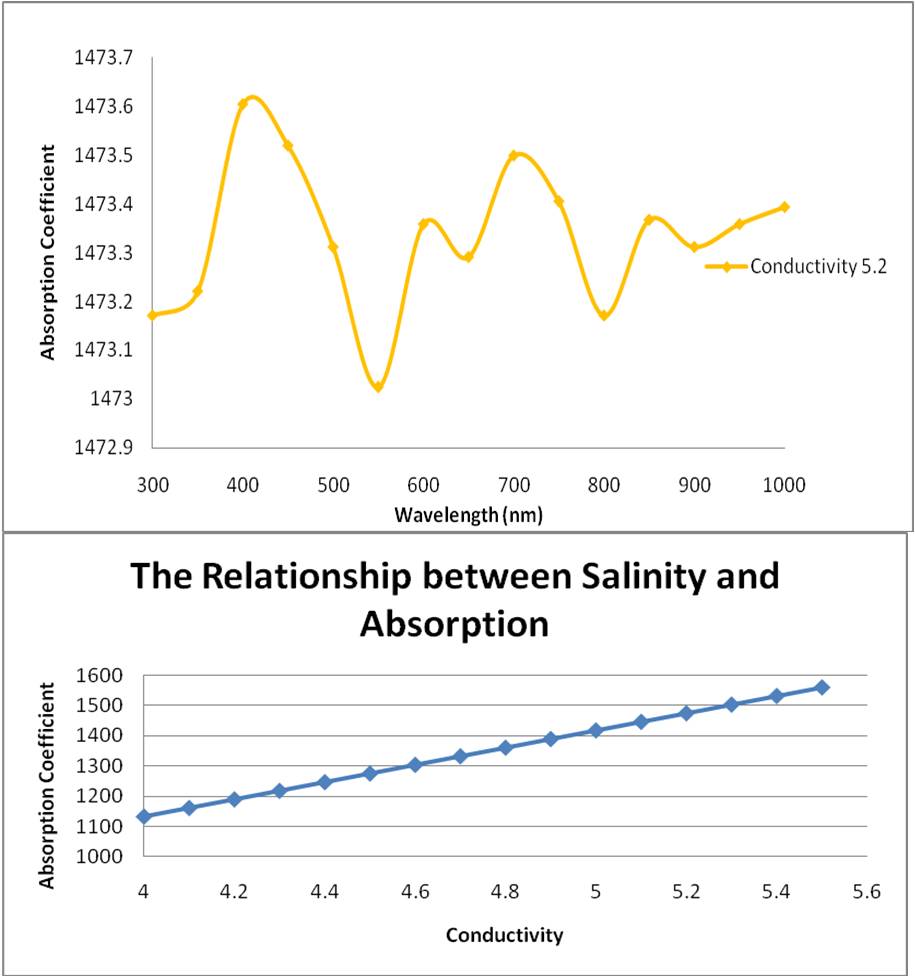
Thus the value K, can be calculated for each frequency and hence the absorption coefficient. The absorption coefficient was mapped against the wavelength and the results displayed below:
The relationship between skin depth and wavelength:
Discussion:
Salinity is related to the dissolved organic matter. Dissolved organic matter is higher in fresh water compared to ocean water. Colored dissolved organic matter (CDOM) is the optically measurable component of the dissolved organic matter in water, and generally absorbs more short wavelengths such as blue light. A lower CDOM absorbs more of the red light, longer wavelengths. Thus in high salinity ocean water, the CDOM is lower and absorption of the longer wavelength light, red light, increases. This explains the general trends in the three absorption – wavelength graphs indicated above. As the salinity increases, the conductivity increases and there is a shift towards high absorption in the longer wavelength (for example the first peak of the graph gradually approaches a higher wavelength).
However, it is interesting to note, that in lower salinity graph (graph 1), the absorption coefficient is lower for blue light than that of the high salinity graph (graph 3). This contradicts my initial hypothesis that with increasing salinity, or conductivity, absorption of the longer wavelength red light increases. Despite that however, the general trend of the graphs indicate a gradual shift towards higher wavelength absorption with an increasing salinity.
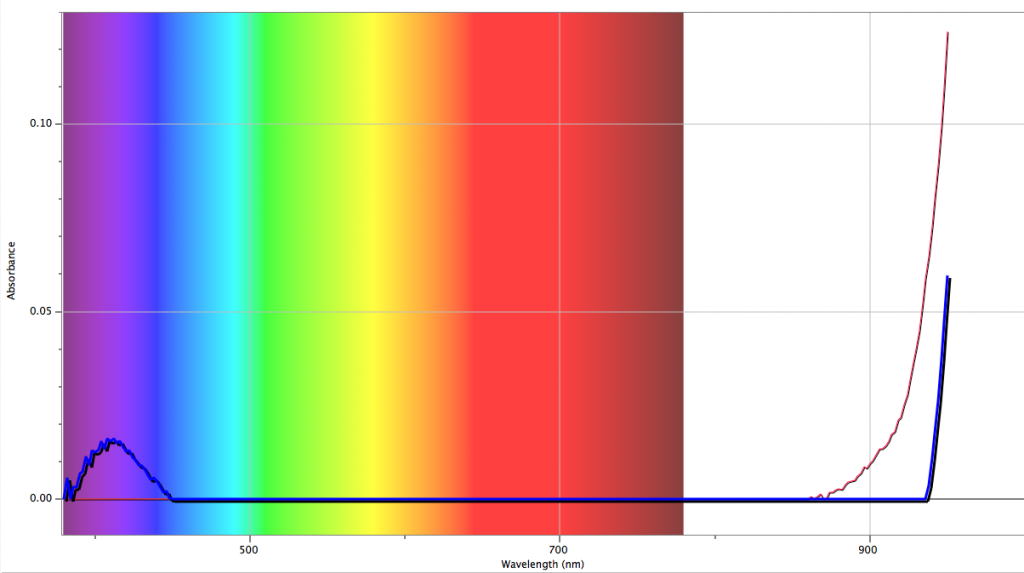
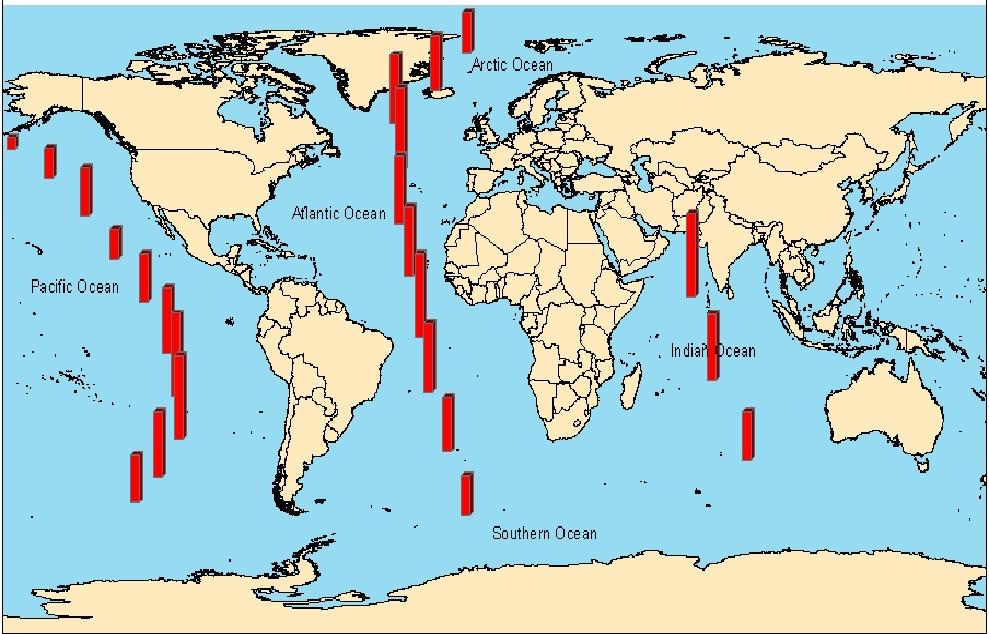
A sea water sample of salinity 35 parts per thousand, or a conductivity of 4.8 S/m was taken from the offshore Bermuda and the sample yielded results similar to the model of at a conductivity of 4.8 S/m (see figure above). The sample site, along the northern coast of Bermuda, is in the Northern Atlantic. However, the Central Atlantic has generally higher salinity levels, up to 37 parts per thousand, and a global rise in temperature can cause a northern migration of the central Atlantic high salinity waters. The locality of Bermuda is indicated on the world salinity map below.
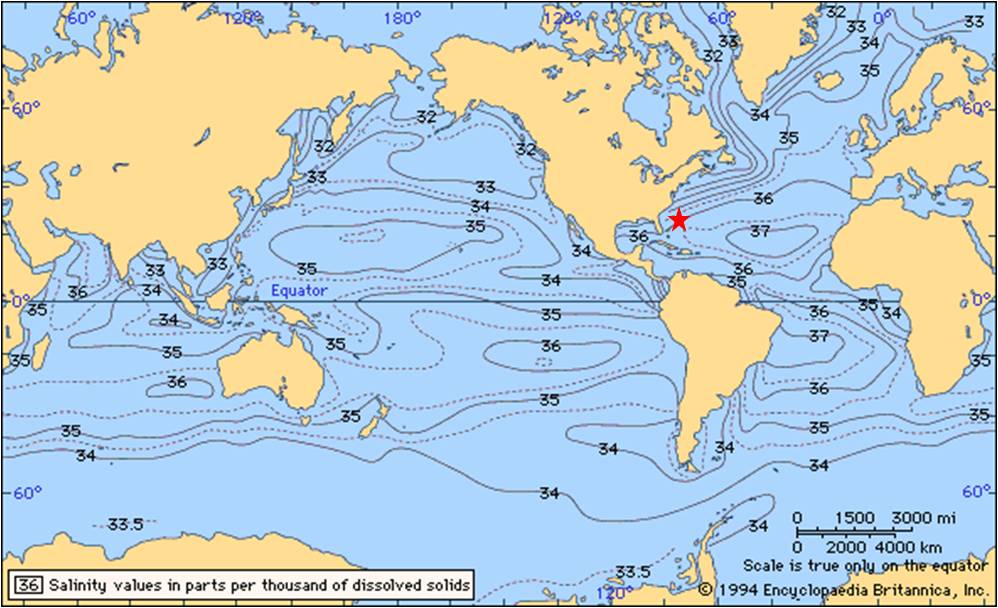
The map below indicates the increasing absorption trend with increasing salinity. In the Arctic and Southern Ocean, salinity levels are lower, thus the absorption is lower. Near the equator, salinity level are higher because of higher rates of evaporation, thus absorption is highest in these regions. Additionally, as salinity increases, absorption increases and skin depth decreases.

Yours work is great!!! world salinity map – very interested pic!!!
This looks great, and the results are really interesting. I had the same question as Rachel: why does the absorption coefficient vary so greatly (and even oscillate) as the wavelength changes? Additionally, the first two graphs seem to trend downward while the third trends upward. You seem to be plotting several points of data in these plots and doing a regression. Where is the data coming from?
My last question is how does the skin depth vary for light outside of the visible range? Your results make an obvious argument for the use of sonar over some sort of laser system for determining the depth of the ocean, but is there a wavelength that would be able to reach the bottom?
This is a great blog! I really like the fact that you collected an ocean sample while you were in Bermuda. Maybe make the graph with the light spectrum a little bigger bigger, its hard to read the label and numbers on each axis. Im excited to see the map you create with the different skin depths and absorption coefficients across the world’s oceans.
I found absorption coefficient versus wavelength graphs very surprising. I would have imagined a less varying dependence. Do you know happen to know why that happens or is it just an inherent property? It’s also interesting to see which trends of the spectrum dependence changed (or didn’t changed) as you altered the conductivity. It’ll be neat to see how it changes from ocean to ocean, too.