
Overview
In my project, I will be modelling fusion reaction rates across stars of different spectral types. Specifically, I will be looking at the first step of the proton-proton chain in nucleosynthesis, with the quantum tunneling of one proton into another. The broad categories of spectral type are: O, B, A, F, G, K, and M. They are further divided into subcategories, being assigned their spectral type letter along with a number between 0 and 9 to specify where within a spectral type a given star falls. For my calculation, I will be looking at the intermediate subcategories of these spectral types: O5, B5, A5, F5, G5, K5, and M5. I used mass and radius values for stars for given spectral types from the very helpful table found at: http://www.isthe.com/chongo/tech/astro/HR-temp-mass-table-byhrclass.html.
Spectral Types?
With hundreds of billions of stars existing in the Milky Way Galaxy alone, one can imagine there is a large deal of variety within the population. Naturally, astronomers thought it would be useful to categorize, if at least broadly, types of stars that share similar characteristics with each other. This classification system is known as spectral classification, assigning stars a letter (O, B, A, F, G, K, and M) primarily based on their observed spectra, which is dependent on the star’s temperature. Thus, stars of the same spectral type have similar temperatures, with O being the hottest, and M being the coolest. Further, stars of the same spectral type share characteristics such as mass and radius, which have accepted values. Deeper than their letters, spectral types are broken down more specifically by a following number (0 through 9). For example, O0 stars are more massive, larger, and hotter than O9 stars.
Fusion
Stars produce immense amounts of energy every second, thanks to quantum tunneling. There is no comprehensive classical approach to explaining how fusion could occur in stellar cores due to the Coulomb barrier; but very small, nonzero, probabilities of two protons tunneling does. To determine fusion reaction rates inside of stars, we have to consider two probabilities: 1) the probability of a given particle having a certain energy and 2) the probability of a particle tunneling at a certain energy. Assuming a Maxwellian distribution of energies, these two work against each other in the way that there are less available particles with increasing energy, but higher energy particles have a higher probability of tunneling through the Coulomb barrier. For a given spectral type (since we have a given temperature), we can multiply these two probabilities to obtain a final curve that will have a peak known as the Gamow Peak. The area under the Gamow peak determines the reaction rate!
Maxwellian Distribution
The Maxwellian distribution can be found by the following probability:
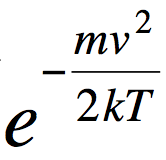
Source: http://astro1.physics.utoledo.edu/~megeath/ph6820/lecture26_ph6820.pdf
where k is the Boltzmann constant, T is temperature, and {(mv^2)/2} is the kinetic energy. We know the value of k, 8.61733e-8 keV/K, and will vary energy; so all that is left to be determined is temperature. While I found accessible values for stellar surface temperature I needed to calculate stellar core temperatures, as that is the site of nuclear fusion. We can find an equation for stellar core temperature by equating the force due to pressure gradient to the gravitational force to obtain: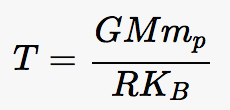 where G is the gravitational constant, M is the mass of the star, m_p is the mass of a proton, R is the radius of the star, and K_B is again, the Boltzmann constant. With this, I calculate that:
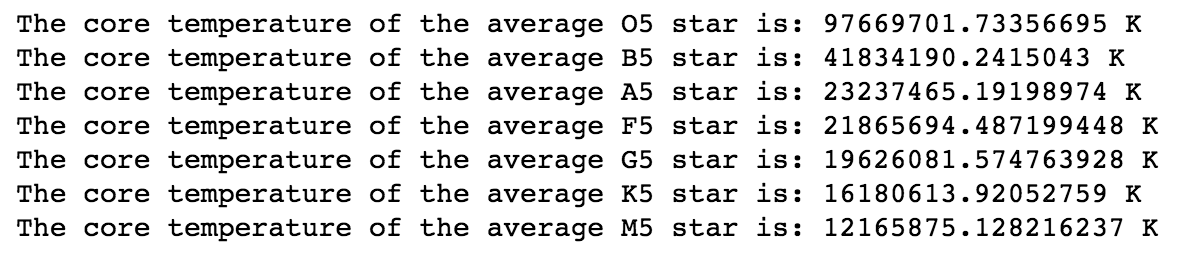
From this, I can plot the Maxwellian distributions: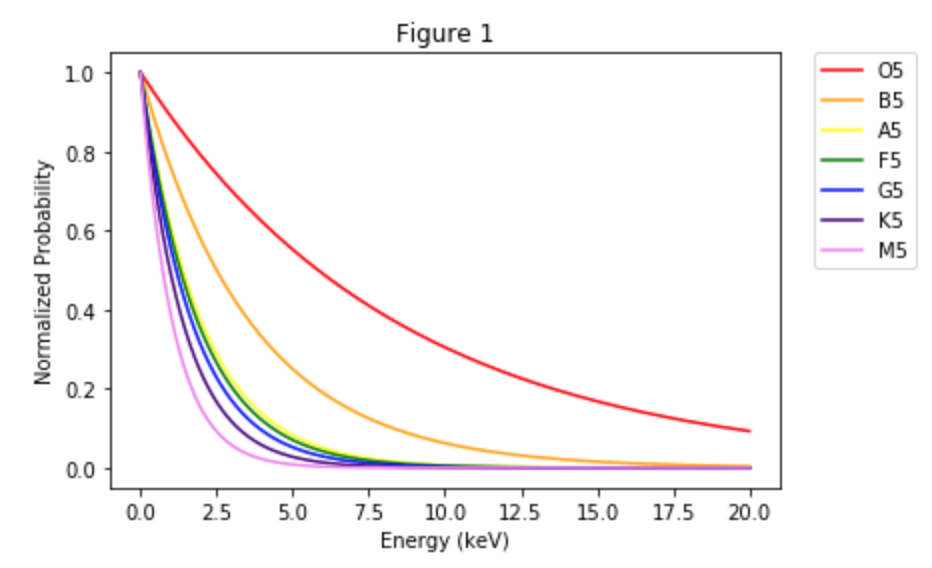
Tunneling Distribution
We can find a single probability curve for quantum tunneling that we can apply to all spectral types since it is independent of temperature. For two nuclear particles to overcome the electrostatic potential, physicist George Gamow found that the probability is: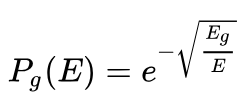
where E_g is the Gamow energy, given by: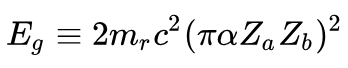
where m_r is the reduced mass of the two particles, c is the speed of light, alpha is the fine structure constant, Z_a and Z_b are the respective atomic numbers of each particle. The last two are equal to 1, since I am only considering at the first step of the proton-proton chain. I find the following: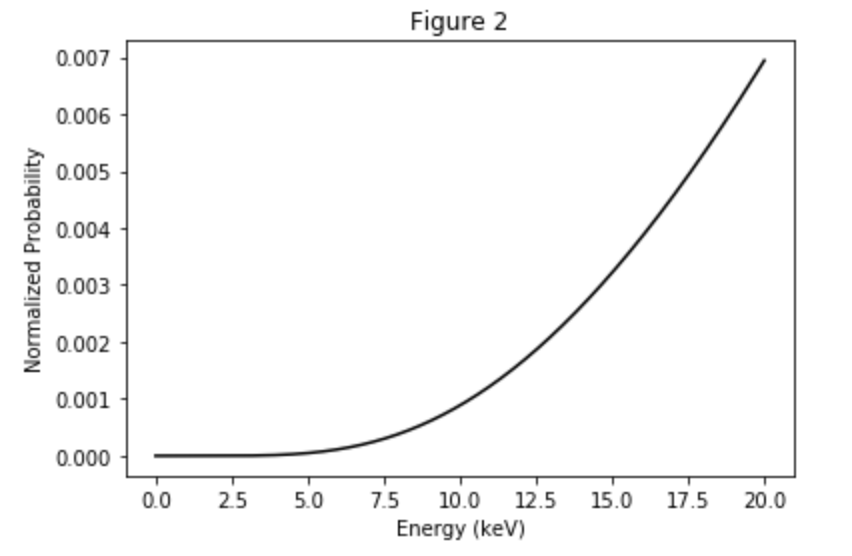
Gamow Peak
From here, I will multiply the Maxwellian distribution of particles for each spectral type by the probability distribution of tunneling. When multiplied together, the function produced represents the probability density function of quantum tunneling given a distribution of particles that have various speeds and thus various energies. The peak of this pdf is called the Gamow Peak. The area under the Gamow Peak determines the reaction rate! I find the following:
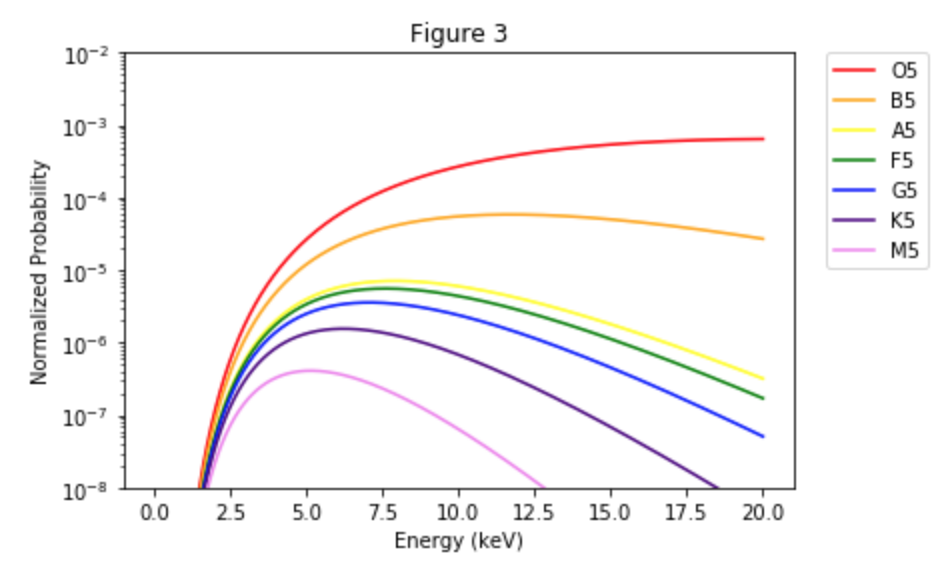
Above is a plot of all the reaction probabilities for each spectral type. Since the luminosity axis of the H-R diagram is logarithmic, our dispersion in temperature is logarithmic, so I thought it would be a bit more useful to display the same plot from Figure 3, with a logarithmic y-axis. It can be seen that the Gamow Peak increases as temperature increases with spectral type, from the coldest stars at M5, to the hottest stars at O5. This indicates that the reaction rates will increase with increasing core temperature, which makes intuitive sense. However, it is more difficult to see a distinct “peak” from the curves of the really hot O5 and B5 stars, due to the increased energy in these cores. The effect of this is that fusion for heavier atoms through the CNO process actually dominates rather than the proton-proton fusion that dominates cooler stars like our Sun. Still, the reaction rates for proton-proton fusion are much higher for hotter stars.
References
- https://ntrs.nasa.gov/archive/nasa/casi.ntrs.nasa.gov/19900009028.pdf
- http://www.isthe.com/chongo/tech/astro/HR-temp-mass-table-byhrclass.html
- http://www.astro.caltech.edu/~jlc/ay219_spring2010/nuclear_reactions_18april2010.pdf
- http://zuserver2.star.ucl.ac.uk/~idh/PHAS2112/Lectures/Current/Part7.pdf
- https://en.wikipedia.org/wiki/Gamow_factor#cite_note-2
Link to Code
I did all of my work in a Jupyter notebook using Python. It is annotated so that hopefully one can follow along with the code:
