
Measuring and Modeling Physical RCL Circuits
Purpose and Goals:
The purpose of this project is to demonstrate the difference between theoretical descriptions/relationships of basic LC circuits and experimental values. This is also an exercise in developing a deeper understanding of the theoretical equations governing these relationships. I will record the voltage drop across various components in each circuit and plot them in comparison to the theoretically predicted values. In addition, I will try to answer questions such as “What are the probable causes for deviation from predicted values?”
The first and most simple circuit I will work with is a basic LC circuit:
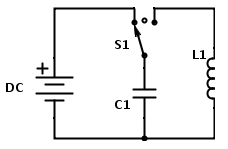
The DC power source charges the capacitor until it is discharged (via switch) into the right hand circuit. In theory the current should oscillate back and forth between the capacitor and inductor indefinitely if there was no resistance in the circuit. Actual experimental measurements should reveal some resistance due to the wires and components themselves. Below is the start of my derivations for the voltage across each components:
Kirchoff’s Loop Law states that the total voltage drop across the right hand circuit loop should be zero:
 (1)
(1)
We know that the voltage drop across an inductor is equal to L(dI/dt) and across a capacitor is Q/C:
 (2)
(2)
Which can be rewritten as
 (3)
(3)
Leaving us with the general solution to this second order differential equation
 (4)
(4)
The derivation of the above equations will be more thorough in future posts.
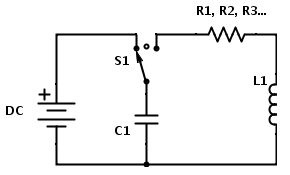
RLC circuit
This circuit is dampened with a resistor, and thus no longer resembles simple harmonic motion, but rather a damped harmonic oscillator.
Kirchoff’s Loop Law now reads
 (5)
(5)
 (6)
(6)
Which leaves us with a new second order differential equation
 (7)
(7)
 (8)
(8)
 (9)
(9)
 (10)
(10)
 (11)
(11)
Eq. (11) is the second order differential equation governing the charge on the capacitor as a function of time and thus describing the voltage drop and current through the other components of the circuit.
Predictions
Theoretically I should expect the voltage across the components in an LC circuit to oscillate indefinitely according to simple harmonic motion. I expect that with a real circuit this would not be the case. A physical LC circuit would actually behave as if a resistor was in series with the two components, causing the amplitude of the oscillations to decrease over time. This is because the circuit parts, such as the wires connecting each component, are not ideal and have resistance.
I predict that a graph of the voltage difference over time for a given component will appear as a decaying sinusoidal wave. In other words it should resemble an dampled oscillation.
Methods
I will use a PicoScope digital oscilloscope to measure the voltage difference across the capacitor in the LC circuit. In this way I will both be able to see the voltage the capacitor is initially charged to as well as record the transition from a steady voltage to an oscillating voltage.
Sources, Resources, and Parts Needed
Equipment Needed:
- DC power source, AC frequency generator, Oscilloscope, Computer, Multimeter
Parts Needed:
- Breadboard; various values of resistors, capacitors, and inductors; switch; wires/alligator clips
Helpful Texts:
- Physics for Scientists and Engineers: A Strategic Approach with Modern Physics (2nd ed.) by Randall D. Knight
- Introduction to Electrodynamics (4th ed.) by David Griffiths
- Data Reduction and Error Analysis for the Physical Sciences by Philip R. Bevington, D. Keith Robinson
- Experimentation : an introduction to measurement theory and experiment design by D.C. Baird
- Ordinary Differential Equations by Morris Tenenbaum and Harry Pollard
- Class notes – Classical Mechanics (PHYS 210), Zosia Krusberg.
Websites:
-
http://www.digikey.com/schemeit (for creating circuit schematics)
Timeline
Week 1 – April 20th-26th. Acquire all equipment and parts needed for experiment: Talk to Larry Doe for parts and possibly a power source. Talk to David Rishell about an AC signal generator. Setup experiment in Mudd 216 with Prof. Magnes’ oscilloscope, DC power source, and multimeter.
Week 2 – April 27th-May 3rd. Derive equations to predict voltage drop across components to plot on top of collected data. Those equations being ΔV for LC, dampened LC (RLC), and AC driven RLC in series circuit. Collect data on voltage drops across LC and dampened LC circuit components. Plot data in mathematica.
Week 3 – May 4th-10th. Collect data on voltage drops over AC driven circuit. Predict resonance frequency. Define equations governing resonance frequency and find actual resonance frequency of circuit. Plot findings in mathematica. Consider sources of error or causes of deviation from predicted values on all three circuit configurations.
Week 4 – May 11th-17th. Finish data collection and additional exploration/inquiry. Create time dependent plots in mathematica to demonstrate projected vs experimental values.
Place/Logistics
Experimentation and data collection will occur in Professor Magnes’ lab in Mudd 216. Brian and Tewa generally work MWF and can be contacted for access to the lab.

What kind of differences between experimental and theoretical results do you expect? Exactly what will you be measuring? Voltage? Current? Power? Resistance? … What measurement devices will you use? I expect your results to be illuminating.