
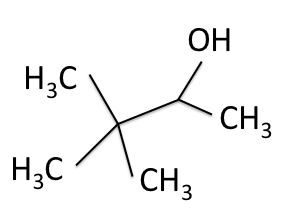
Now that we’ve analyzed both the  H-NMR and the
  C-NMR spectra, we can see how the results come together and give the structure of 3,3-dimethyl-2-butanol. Below we bring back the two figures that show the labeled hydrogens and carbons of the molecule:


If we did not already know the identity of the molecule, we could have determined it using only the four spectra previously shown–the H-NMR, the C-NMR, the DEPT-90, and the DEPT-135–by following the guidelines laid out in the previous posts. Peaks on the four spectra work together to give bits of information about pieces of the molecule, and those pieces are put back together at the end of the analysis.
To summarize, we began by taking advantage of the magnetic properties of H and C nuclei to learn about the environment of each nucleus in the molecule. Radio waves were pulsed at the sample to record small changes in the resonant Larmor frequency of the nuclei. The change happened because electrons around each nucleus became a current when influenced by the NMR’s external field, and generated their own fields in the opposite direction according to Lenz’s Law. This new, effective magnetic field resulted in changes in the Larmor frequency of each nucleus. It is these changes that are displayed on the spectra as chemical shifts. The chemical shift is measured in ppm of the original Larmor frequency of the nucleus.
Using the Larmor frequency equation below, and the shifted frequencies, we calculated the shielding factor  for each nucleus. The shielding factor is another measure of the relative electron density around each nucleus.
(1) 
Combining the information from the spectra gives the structure of 3,3-dimethyl-2-butanol, which is shown again below.

Good work! I am definitely walking a away with a new NMR perspective. People usually think of the medical applications… not chemical analysis…
Do mind copyright issues with images used.
It’s not a silly question at all. The technique itself doesn’t require much sample. If you add a bit more than usual you’ll generally increase each signal you get, but there’s a risk of overloading the detector if you put in too much sample. Speaking of cleaner spectra, there’s a special risk when one does Carbon-13 NMR. Normally, because the ratio of C-12 to C-13 in the environment is about 99 to 1, we don’t scan many molecules with multiple C-13’s in them. If there’s too much sample, the likelihood of scanning and finding molecules with more than one C-13 increases, and one risks dealing with signal splitting and peak alteration that results when two C-13’s are near each other. It can get even more complicated if your molecule has other NMR active nuclei like phosphorus or fluorine. Then those nuclei will split your carbon and hydrogen peaks and make your spectra look even less clean. We won’t go there.
This may seem like a silly question, but I have a question about concentration. Since the molecule that is being analyzed is in a solution, I was just wondering if NMR is at all concentration dependent? How are the solutions made and is there a standard concentration used? Is the spectra produced “cleaner” or more “noisy” depending on concentration since possibly (?) at higher concentrations the molecules may clump together or form some sort of very minor bond?