
This summer I worked with Professor Sarah Pearlman studying the effect of media exposure on women’s likelihood to study or work in computer science. The work completed this summer will be used in a future paper by Professor Pearlman in collaboration with Professors Emily Conover of Hamilton College and Melanie Khamis of Wesleyan College. Our research was inspired by a Planet Money podcast titled “When Women Stop Coding,” which documents and attempts to explain why women are drastically underrepresented in both computer science majors and occupations. In the podcast, the hosts discuss the following graph, which we recreated:
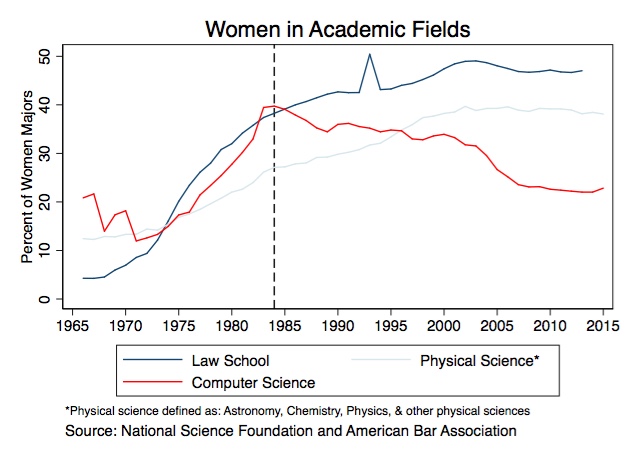
As the graph shows, the trend of female participation in computer science differs from other STEM and high-paying fields—falling drastically after 1984—while female participation rates in all other fields continue to increase. Inspired by Planet Money’s motivating graph, we set out to explain why women are underrepresented in computer science, and in particular, why the trend shifts in 1984.
The first two weeks of the project were spent conducting a literature review of the existing research on the gender wage gap, female occupational choices, the effect of media exposure on individuals, and the cable TV industry. Many sociology and history papers suggest that depictions of computer science in the media may dissuade women from entering the field. Interestingly, 1984 is the year in which the cable TV industry was deregulated by the Cable Communications Policy Act of 1984, causing a large market expansion for cable providers. At the same time, computer science (and more specifically, the nerdy, male computer scientist trope) was gaining traction in American media, as evidenced by movies such as WarGames, Revenge of the Nerds, and Weird Science. In conjunction, the trend in media and cable deregulation and the concurrent industry surge may have caused girls in the 1980s to witness extremely sexist depictions of computer science at a much higher rate than before. This could potentially have led to a drop in female interest in computer science, which would be followed by a drop in female participation in computer-related academia. Due to how cable was developed and how it physically functioned, our hope is to exploit the pattern of cable expansion over time to find natural experiments in which some communities received cable TV access before others by pure chance.
Though we had our plan of analysis mapped out, obtaining the exact data set with which to conduct the analysis was a more complicated matter. It took several weeks to locate the data, but that gave us time to clean other data sets and generate summary statistics, motivating regressions, and graphs to contextualize our research. After reaching out to government agencies, private companies, and libraries, a research librarian at the New York Public Library finally pointed us in the direction of the “Broadcasting/Cablecasting Yearbook, 1989.” We took a day trip to the Science, Industry, and Business branch of the New York Public Library and photocopied over 300 pages of data, which we then manually entered into a spreadsheet for over a week.
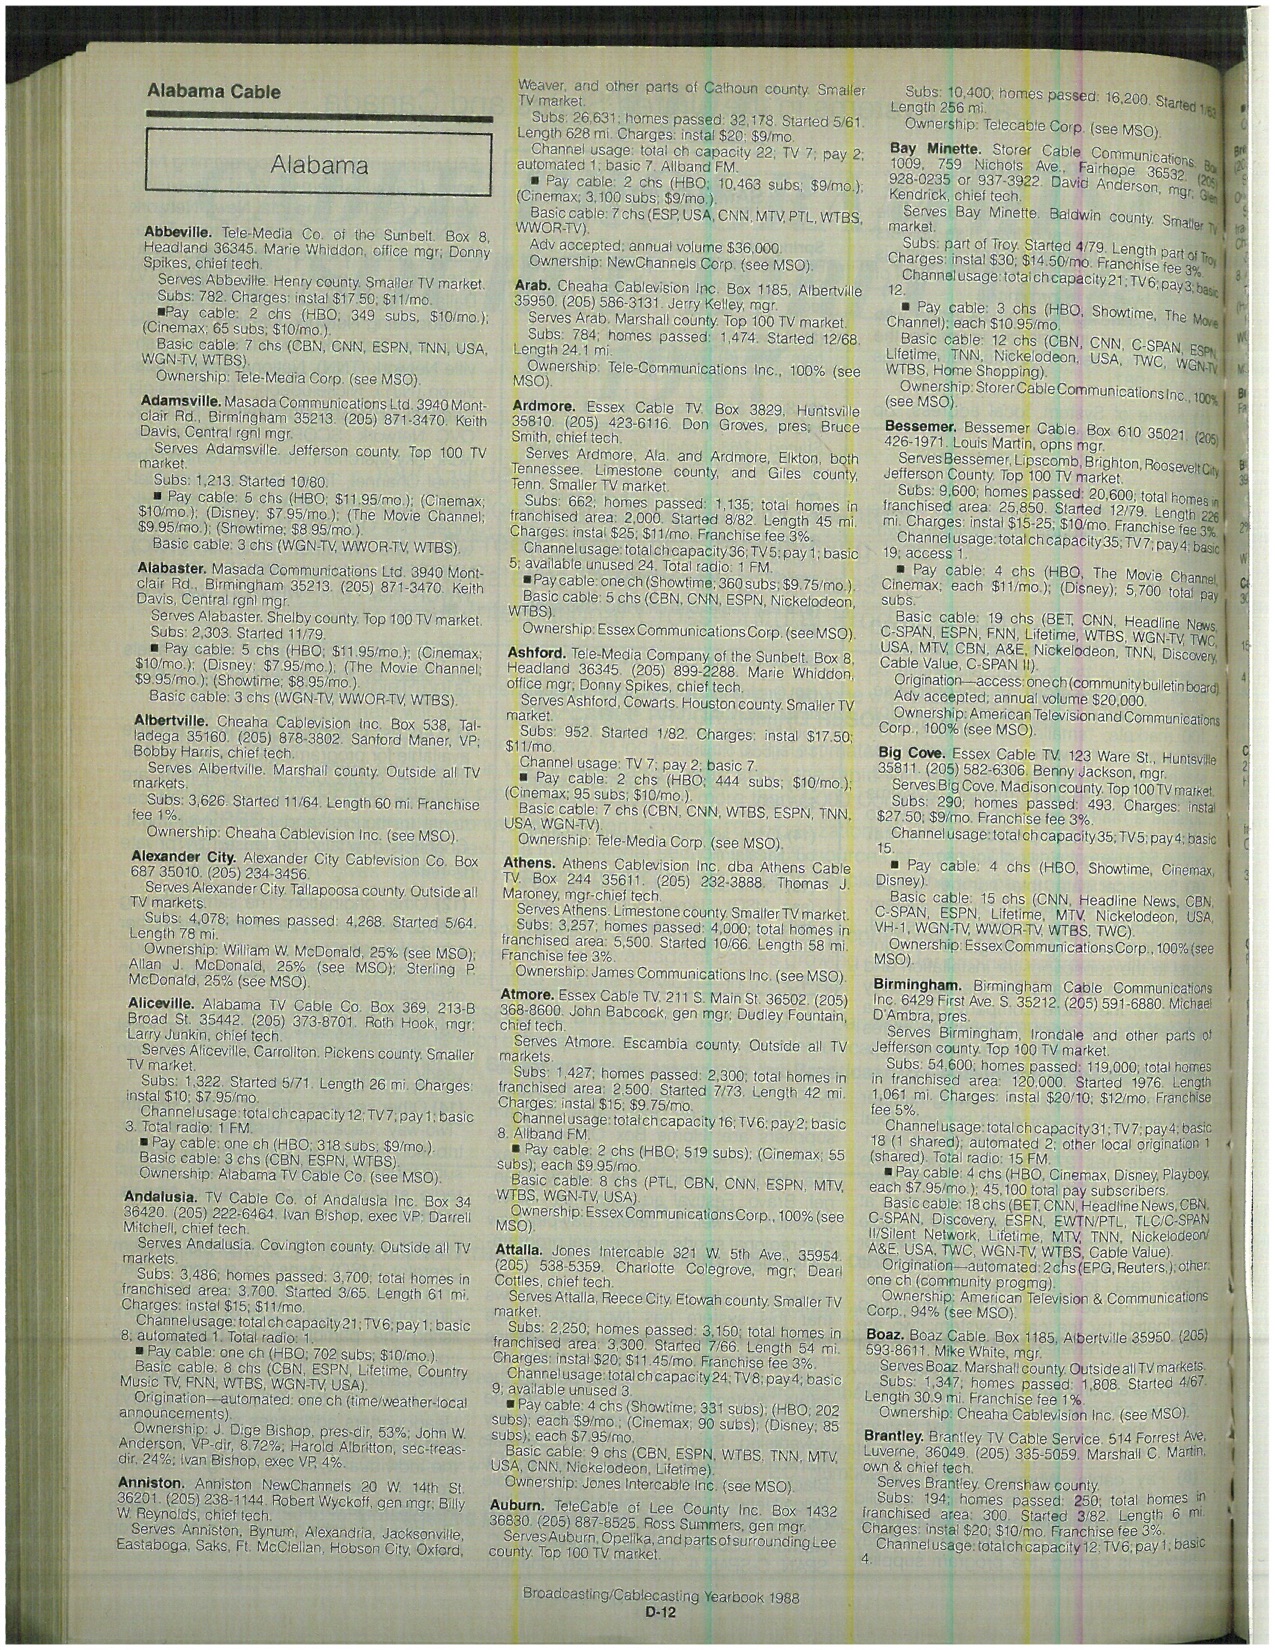
1 of 300 pages of raw data
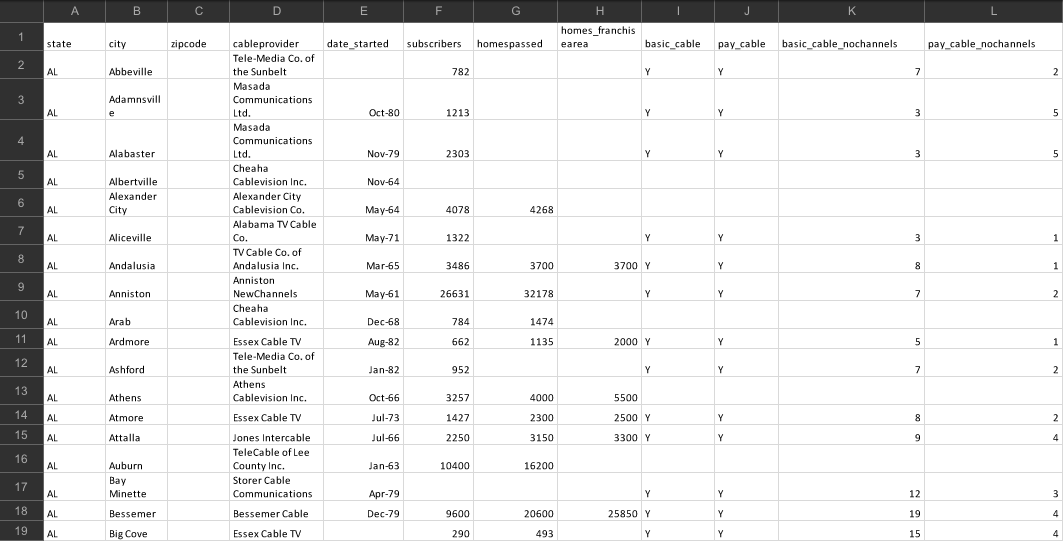
Corresponding data entry
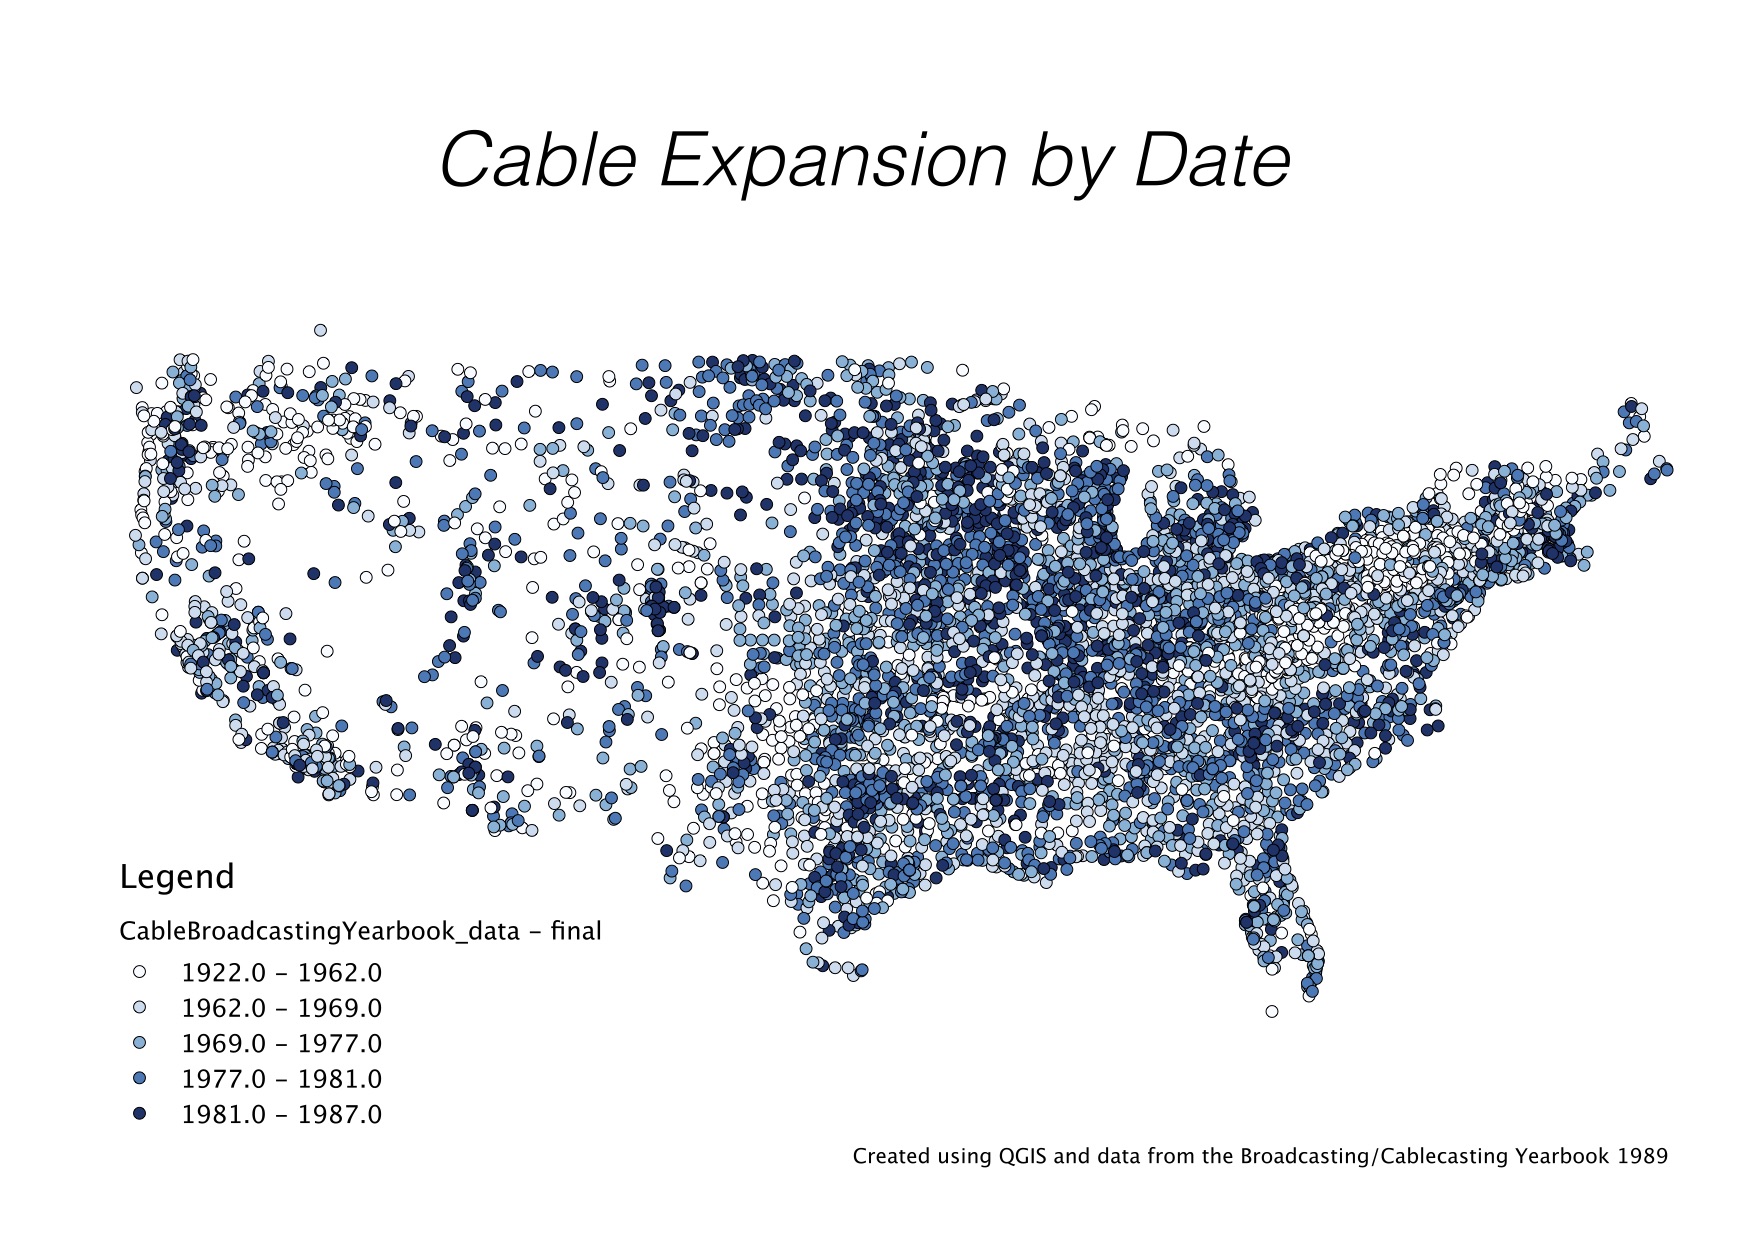 Once completed, we were able to run preliminary regressions in Stata and began learning how to use GIS (a map-based analysis software). After only a few days of working with GIS, we were able to create a map which shows cable expansion over time.
This project has provided me with an invaluable glimpse into the day to day process of economic research and has provided me with a multitude of important research skills beyond what ordinary classwork requires.