Citrix Demystified

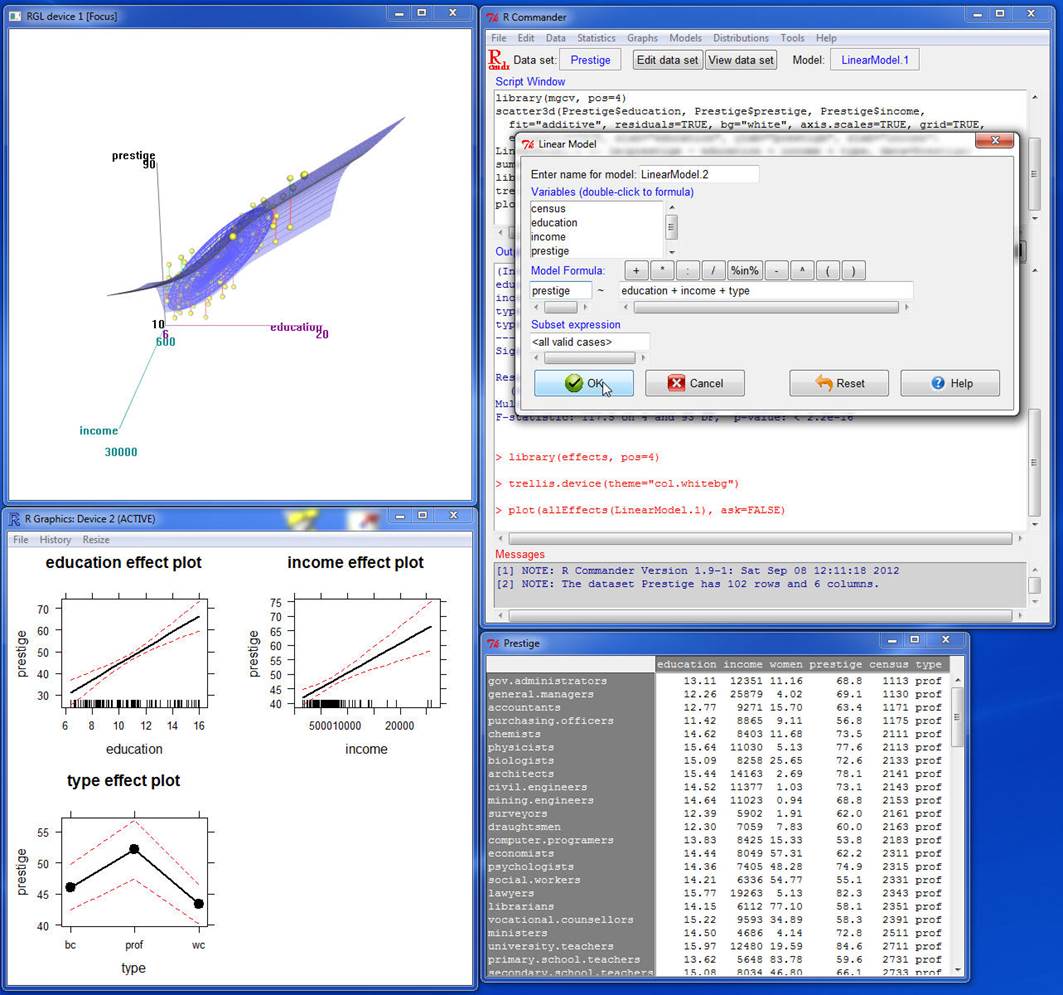
Citrix is an application virtualization product that allows users to connect to a suite of applications not installed on your computer from a wide range of computer systems and mobile devices, both on and off campus.  One way to access Vassar’s Citrix applications is to install the Citrix Receiver on your computer or device.  Alternatively, you can use a web browser to access the Citrix applications via VApps (Vassar Virtual Applications), which can be found at http://vapps.vassar.edu.  Academic applications available on Citrix, via either the Citrix Receiver or VApps, include JMP, MATLAB, SAS, and SPSS, among others.  The VApps web interface is shown in Figure 1.

VAPPS_2

Figure 1. View of a typical VApps session.

LOAD BALANCING

While the ability to access software via Citrix is an invaluable resource for faculty and students alike, both factions have historically found the file system to be confusing and frustrating.  Faculty frequently inquire, “Where should I save my files?” or “Where did my files go?”  Much of the confusion results from the fact that all applications on Citrix are configured to be load balanced between two or more servers.

Load balancing is a way to distribute incoming traffic among servers hosting the same application content.  Load balancing aims to optimize resource use, maximize throughput, minimize response time, and avoid overload of any single resource (Wikipedia, 2014).  When one application server becomes unavailable, the load balancer directs new application requests to other available servers in the pool. When you launch an application on Vassar’s Citrix system, you will be directed to a given server based upon a set of rules designed to keep the system load balanced.  There is no way to specify a specific server when you log on.  If you were to save files to the Citrix server during one session (Server A), there is a 50% chance (or more) that you will be directed to a different server (Server B) on a subsequent session.  When this happens, you will not have access to files saved during your previous session.  It will seem like your files have disappeared.  Eventually, you will end up back on Server A, and your files magically reappear.  The load balancing configuration used by Vassar’s Citrix applications is likely the primary reason many Citrix users have had been so baffled by the file system.

SAVING FILES

Where should you save your files when working on Citrix?  There are a few options to choose from.  Select “Save As” and scroll to “Computer” in the drop down menu.  You will see a number of drive options similar to those shown in Figure 2.

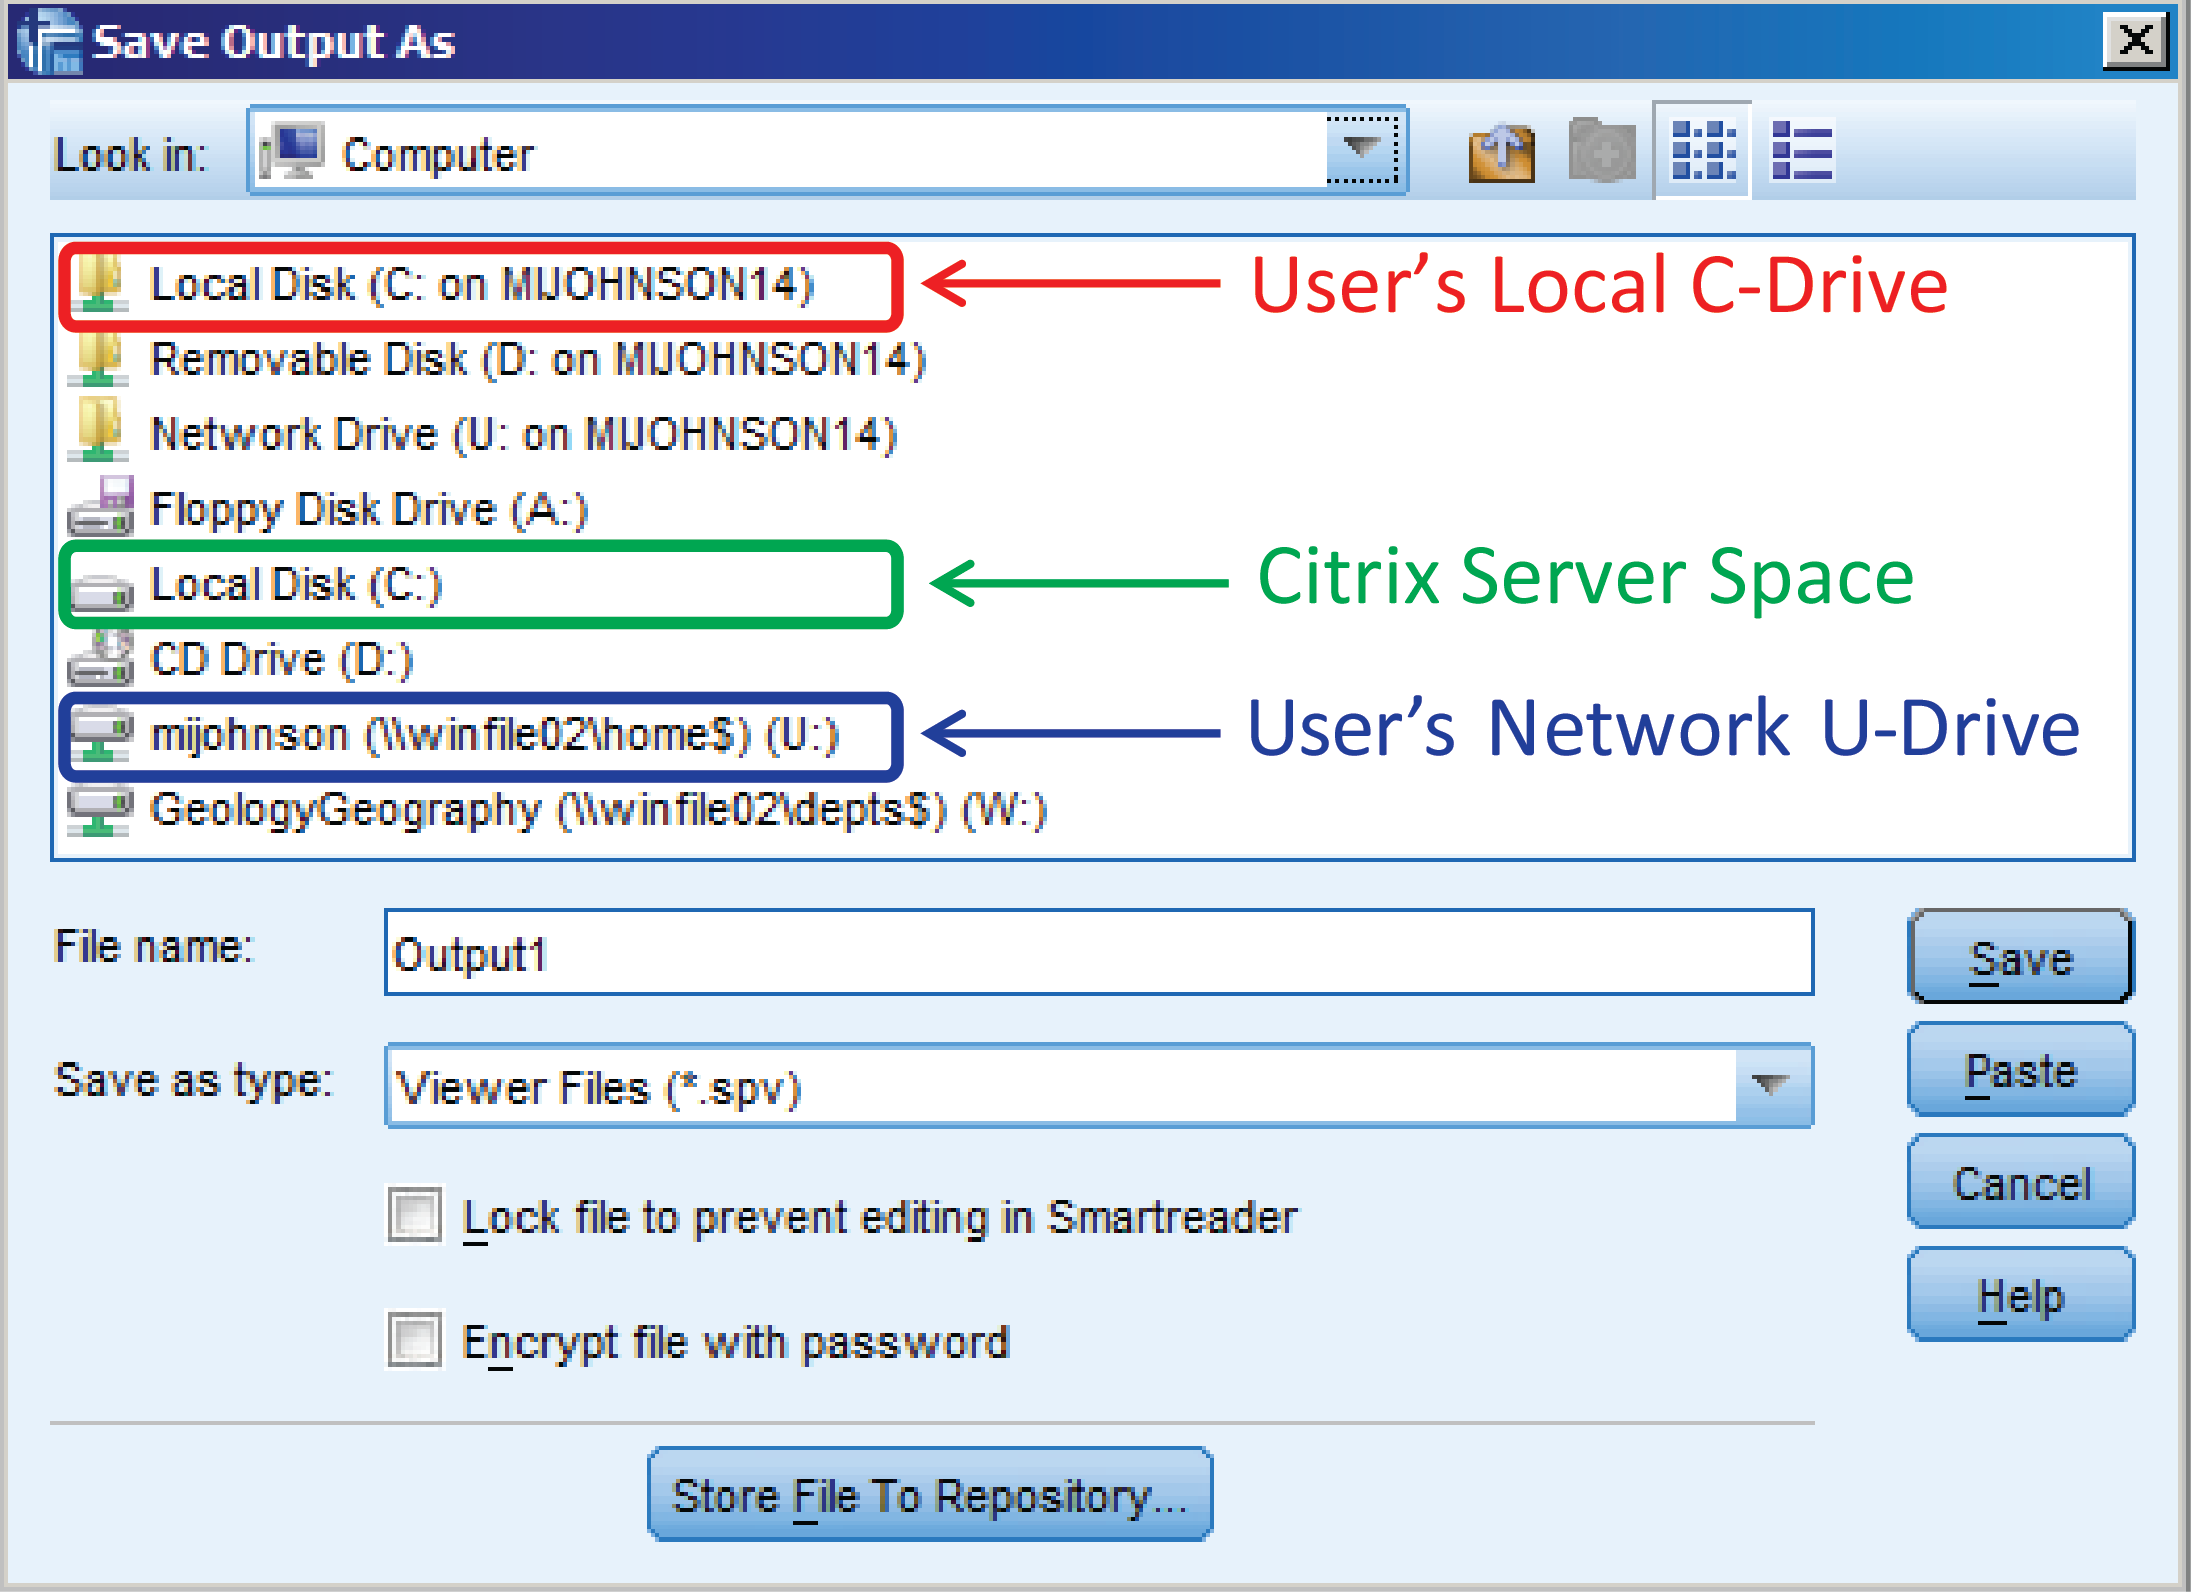
Figure 2. Common options for saving files on Citrix are shown. Do not save files to the Citrix server space, indicated by the green box. Your network U-drive, indicated by the blue box, is the ideal place to store your Citrix files. Alternatively, you may store files on your local drive.

Your U-drive, a network drive that you can access from any Citrix server, is the best place to store your Citrix files.  It is by far the safest environment to store files, because it is backed up 24/7/365, with up to 3 levels of media.  Each user is allotted up to 2 GB of U-drive storage.  Your U-Drive will be identified as: username (\\winfile02\home$) (U:).  Your Vassar user name will replace “username” as shown in Figure 2.  Students’ U-drives will be identified as:  username (\\stufile02\home$) (U:).   If you choose to save to your local machine, you will not, in most cases, be able to access those files when you are working from another location.  For example, files saved to your office desktop computer will not be accessible when you are working from home.

SIMPLIFYING ACCESS TO YOUR FILES

I recommend that you create a separate folder on your U-drive for each VApps application that you use.   Settle on a clear, consistent naming convention (e.g., My SAS Files, My JMP Files, etc.).  You can create these folders the first time you save to your U-drive from a given program.  Depending on the program, “Save As” will offer you the option either via a new folder icon (new_folder_star or new_folder_plus)  or a “New Folder” button near the top of the “Save As” window. Alternatively, you may be able to access your U-drive via your local computer. Most Windows allocations will be set up with your U-drive as a mapped network drive.  In this case, you can simply open Windows Explorer and navigate to Computer → username (\\winfile02\home$) (U:), where you can create new folders and access your files.  This drive is normally not mapped on Mac allocations.  To connect to your U-drive from a Mac, click on the Finder, go to the “Go” menu, and click on “Connect To Server.” Enter smb://winfile02.vassar.edu/home$/[username] in the Address field, click the “+” button to save to favorites, and click “Connect” to mount the space.  The space gets mounted at /Volumes/[username], but it should also appear on the desktop, depending on how the Finder preferences are set.

Once you have created new folders to organize your U-drive, you can create shortcuts, default folders, libraries, etc. that will simplify access to your files.  Unfortunately, the process must be repeated, due to load balancing, in order to implement access points on each server hosting the particular software being used.  You should use the same name on each server for whatever access points you create.  Since you cannot specify which server will be used for each Citrix/Vapps session, it may take a few VApps sessions (logging out and logging back in) before you have logged into each server and created identical access points on each.  Below are some examples of how to facilitate access to your U-drive.

  • SAS
    • Create SAS libraries linked to a folder on U-drive.  Click Tools → New Library. Give the library a name, click the “Enable at startup” box, browse to the appropriate folder on your U-drive (Look in: Computer), and click OK.
    • Make shortcuts to specific files.  Click Tools → New File Shortcut.  Give the shortcut a name and click the “Enable at startup” box.  Then, browse to the appropriate folder, and click OK.
  • JMP
    • Set file location preferences via the File → Preferences menu.  Select “File Locations” and set preferred locations for the “Data Files” and “Save As” directories.  Browse to the appropriate folder, click the box to “Always go to this directory…,”  Apply the changes and click OK.
    • Create a new Project via the File → New → Project menu or by clicking the “New Project” icon (jmp_new_project) in the Projects window.  Right-click on the new Project to add folders and documents from your U-Drive and change other settings.
  • SPSS
    • Define startup folders for Open and Save dialogs.  Select Edit → Options and click on the “File Locations” tab.  Browse to the desired folders on your U-Drive.  Click Apply, and then OK.  Provide Session Journal location and file name, if desired.
  • MATLAB
    • Reset default “userpath” and change startup folder to new userpath.
  • Origin Pro
    • Specify your “User Files Folder.”  Select Tools → Options and click on the “System Path” tab.  Click on “User Files Folder” and click the “Change…” button.  Browse to the designated folder on your U-Drive. Click OK to select the folder, to change the path of the folder, to close the restart notification, and finally to close the Options window.  Restart Origin to implement the change.

Remember that you will have to repeat the process on subsequent sessions until you have done so on each server hosting a particular application.  For a seamless experience, use the same names on each server when creating libraries and shortcuts.

Share

Voice-Over Slideshows

powerpointNarrated recordings of slides can be useful for providing supplementary information to students, or to help prepare for upcoming class activities.  They can serve as a component of a flipped, or partially-flipped, classroom, or simply provide complementary material for a traditionally-structured classroom.  Microsoft PowerPoint and Macintosh’s Keynote are two of the most popular software options for producing slideshows.  In Keynote, narration of a slideshow results in a single audio file, whereas a PowerPoint slideshow narration produces individual audio clips for each slide.  The single audio file model of Keynote introduces some difficulties when one wants to insert a slide, or rearrange slides, after the full presentation has been recorded.  While one can generate individual audio clips in an external program, such as QuickTime Player, and drag them into Keynote, it is not a simple process and, in the end, PowerPoint wins out for the flexibility and simplicity offered by its model of an individual audio clip for each slide.

usb-headset-ac850_hi

Using your computer’s built-in microphone or a USB microphone, you can create your own narrated slideshow.  The following instructions are specific to a Mac, however the procedure is very similar when using a PC.  After connecting the mic, if necessary, be sure to select the appropriate audio input/output source in system preferences.  Open your PowerPoint file and select the first slide.  Click the tab labeled  Slide Show.  Then, under Presenter Tools, select Record Slide Show.  After selecting Record Slide Show, the audio recording screen opens and recording starts immediately.  You can pause ( ll ), restart ( ↺ ) & continue ( ▷ ) as needed.  Click on the forward arrow at the bottom of the current slide (or use arrow keys) to advance.  Press the esc button or Exit Show at top-center to finish recording.  Select yes when asked if you want to save your slide timings (this includes audio).  As you can see, the procedure for creating a narrated slideshow in PowerPoint is quite simple.

mac_ppt_record_screenshot

Screenshot of audio recording in PowerPoint on a Mac.

Any subsequent editing is also straightforward.  For example, to re-record audio for a single slide, simply select the slide, then select Slide Show Record Slide Show. Make your recording for the individual slide and esc, or Exit Show, when finished.  You may also insert a new slide anywhere in the lineup and add audio to that single slide without causing the audio to fall out of sync on the original slides.  Another layer of multi-media that one may take advantage of is that of adding video/movie clips to slides.  It is not a difficult task and may be worth exploring as an additional enhancement to your presentation.

It is important to save your presentation as PowerPoint Presentation with the filename extension *.pptx.  The format designed to be compatible with earlier versions of PowerPoint (PowerPoint 97-2003 Presentation), which uses the extension *.ppt, has a number of features disabled.  As a result, students watching the slideshow on a Windows machine will not be able to take advantage of the “s” shortcut for pausing and restarting the presentation.  Finally, when you are ready to share your presentation with students by posting it on your Moodle site, for example, you may wish to save it as a PowerPoint Show (*.ppsx).  When students double-click on the file icon, it will automatically launch into the show mode, and they won’t be able to edit your slides.

If you have any questions or would like additional information, please contact Shelly Johnson, ACS liaison for the Sciences, at x7866 or mijohnson@vassar.edu.

Share

R for Data Analysis and Graphics

RR is becoming the most widely used statistical software in academic science and it is rapidly expanding into other fields. R is a free language and environment for data manipulation, calculation, graphics and much more. It runs on all of the major platforms, including Windows, Mac and Linux. While it is command line driven, several good graphical user interfaces (GUIs) exist that open it up to a wider group of users with differing technical abilities.

Popularity

When various metrics for the most popular data analysis software packages are compared (Muenchen, R.A., 2013),  R demonstrates a dramatic increase in popularity over the previous 5 to 10 years.  A plot of posts to email discussion lists, shown below, illustrates a rapid growth in discussion of R.  And over the past few years, R has become the most discussed software by nearly a two-to-one margin.  However, one must be careful when interpreting these results.  For example, the consistently low level of discussion for SPSS may be reflective of the fact that it has a simple interface leading to less of a need for discussion.  However, there are also fewer variations in analysis offered in SPSS than those that exist in R and other applications with somewhat less user-friendly interfaces.

fig_1a_listserv11

Sum of monthly email traffic on each software’s main listserv discussion list. From “The Popularity of Data Analysis Software”, http://r4stats.com/articles/popularity/.

User Friendly Interfaces

Over the past few years, a number of GUIs for R have been developed that make R more accessible to a wider group of users.  RStudio, a popular GUI for advanced users, is what is known as an integrated development environment. This interface is similar to MATLAB, is designed for programmers, and provides syntax highlighting and integrated help among other features.

Screenshot of the popular Rstudio graphical user interface.

Screenshot of the popular Rstudio graphical user interface.


Rcmdr, pronounced Rcommander, is a basic-statistics GUI that offers menus, buttons, and dialog boxes to simplify usage for those with less advanced technical skills. The commands that are generated via the user’s actions are shown in an output window. They can be edited and resubmitted, if desired, helping to familiarize the user with the R language. This is useful for those with moderate technical ability who are interested in learning basic R commands. A third R GUI, Deducer is designed to be a free, easy-to-use alternative to proprietary data analysis software such as SPSS, JMP, and Minitab. It has a menu system to do common data manipulation and analysis tasks, and an excel-like spreadsheet in which to view and edit data frames.

rcmdr

Screenshot of the Rcmdr graphical user interface.

Availability

R and RStudio are installed in the SciVis Lab located in the Mudd Chemistry Building. Additionally, both R and the GUIs mentioned above are freely available and can be easily installed on your personal computer. RStudio also offers a web-based version that can be used in lieu of the desktop version. The availability of a web-based server means that one doesn’t have to install software on a personal computers or go to a computer lab. It can be accessed anywhere there is an internet connection. Our system administrators are in the process of evaluating whether it is feasible to host an RStudio web server on campus, and we are hopeful that this convenience will soon be available to the Vassar community. If you would like to learn more about R, please contact ACS liaison Shelly Johnson.

Share